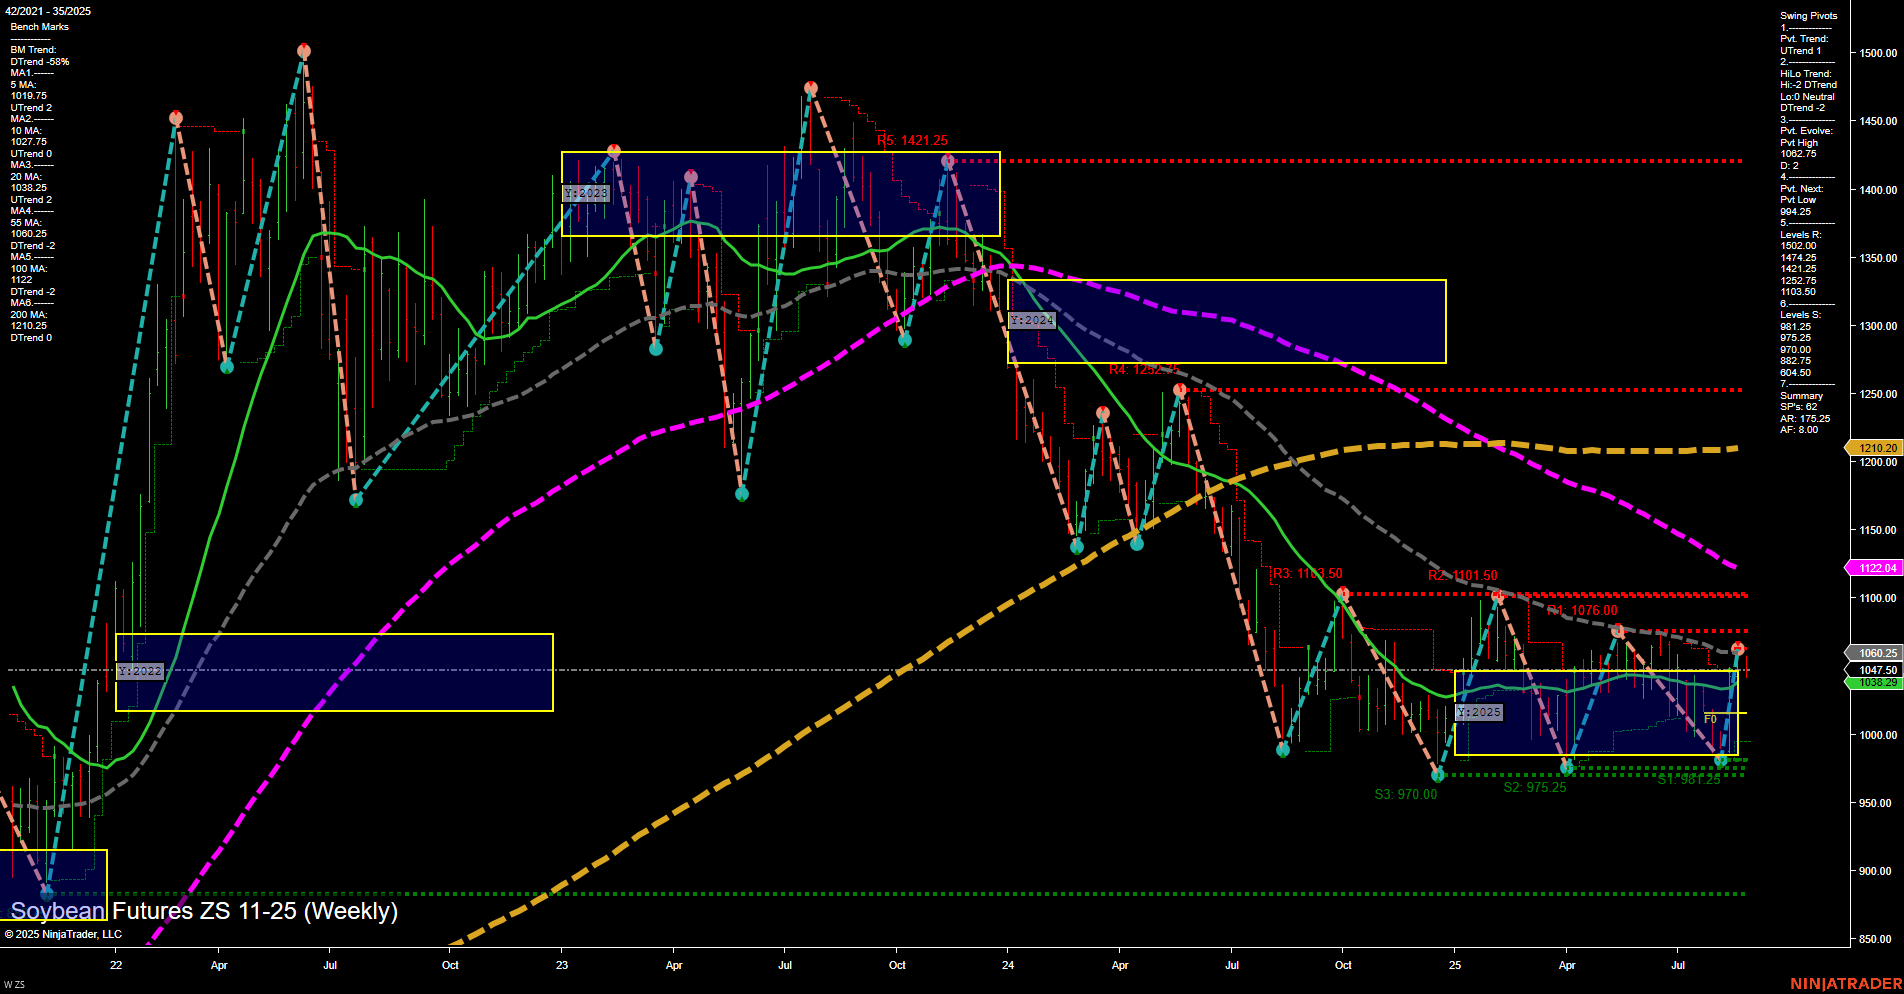
ZS Soybean Futures Weekly Chart Analysis: 2025-Aug-28 07:22 CT
Price Action
- Last: 1049.75,
- Bars: Medium,
- Mom: Momentum slow.
WSFG Weekly
- Short-Term
- WSFG Current: -27%
- F0%/NTZ' Bias: Price Below,
- WSFG Trend: Down.
MSFG Month Aug
- Intermediate-Term
- MSFG Current: 121%
- F0%/NTZ' Bias: Price Above,
- MSFG Trend: Up.
YSFG Year 2025
- Long-Term
- YSFG Current: 10%
- F0%/NTZ' Bias: Price Above,
- YSFG Trend: Up.
Swing Pivots
- (Short-Term) 1. Pvt. Trend: DTrend,
- (Intermediate-Term) 2. HiLo Trend: DTrend,
- 3. Pvt. Evolve: Pvt high 1076.00,
- 4. Pvt. Next: Pvt low 987.25,
- 5. Levels R: 1421.25, 1262.25, 1101.50, 1076.00, 1047.50,
- 6. Levels S: 975.25, 970.00, 862.75, 840.50.
Weekly Benchmarks
- (Intermediate-Term) 5 Week: 1043.25 Down Trend,
- (Intermediate-Term) 10 Week: 1047.75 Down Trend,
- (Long-Term) 20 Week: 1060.25 Down Trend,
- (Long-Term) 55 Week: 1122.04 Down Trend,
- (Long-Term) 100 Week: 1210.20 Down Trend,
- (Long-Term) 200 Week: 1343.93 Down Trend.
Recent Trade Signals
- 27 Aug 2025: Short ZS 11-25 @ 1049.75 Signals.USAR-WSFG
- 21 Aug 2025: Long ZS 11-25 @ 1049.25 Signals.USAR.TR120
Overall Rating
- Short-Term: Bearish,
- Intermediate-Term: Bearish,
- Long-Term: Bearish.
Key Insights Summary
ZS Soybean Futures are currently trading in a slow momentum environment with medium-sized weekly bars, reflecting a market that is consolidating near the lower end of its recent range. The short-term WSFG trend is down, with price below the NTZ center, and both the short-term and intermediate-term swing pivot trends are down, indicating persistent selling pressure. The most recent swing high at 1076.00 and swing low at 987.25 define the current trading range, with resistance levels stacked above and support levels below. All benchmark moving averages from 5-week to 200-week are trending down, reinforcing a bearish technical structure across all timeframes. Recent trade signals show a short bias, aligning with the prevailing downtrend. Despite the long-term YSFG and MSFG showing price above their NTZ centers, the overall technical picture remains bearish, with no clear signs of a reversal. The market appears to be in a prolonged corrective phase, with lower highs and lower lows dominating the chart, and any rallies are likely to face significant resistance at the overhead pivot and moving average levels.
Chart Analysis ATS AI Generated: 2025-08-28 07:22 for Informational use only, not trading advice. Terms and Risk Disclosure Copyright © 2025. Algo Trading Systems LLC.
