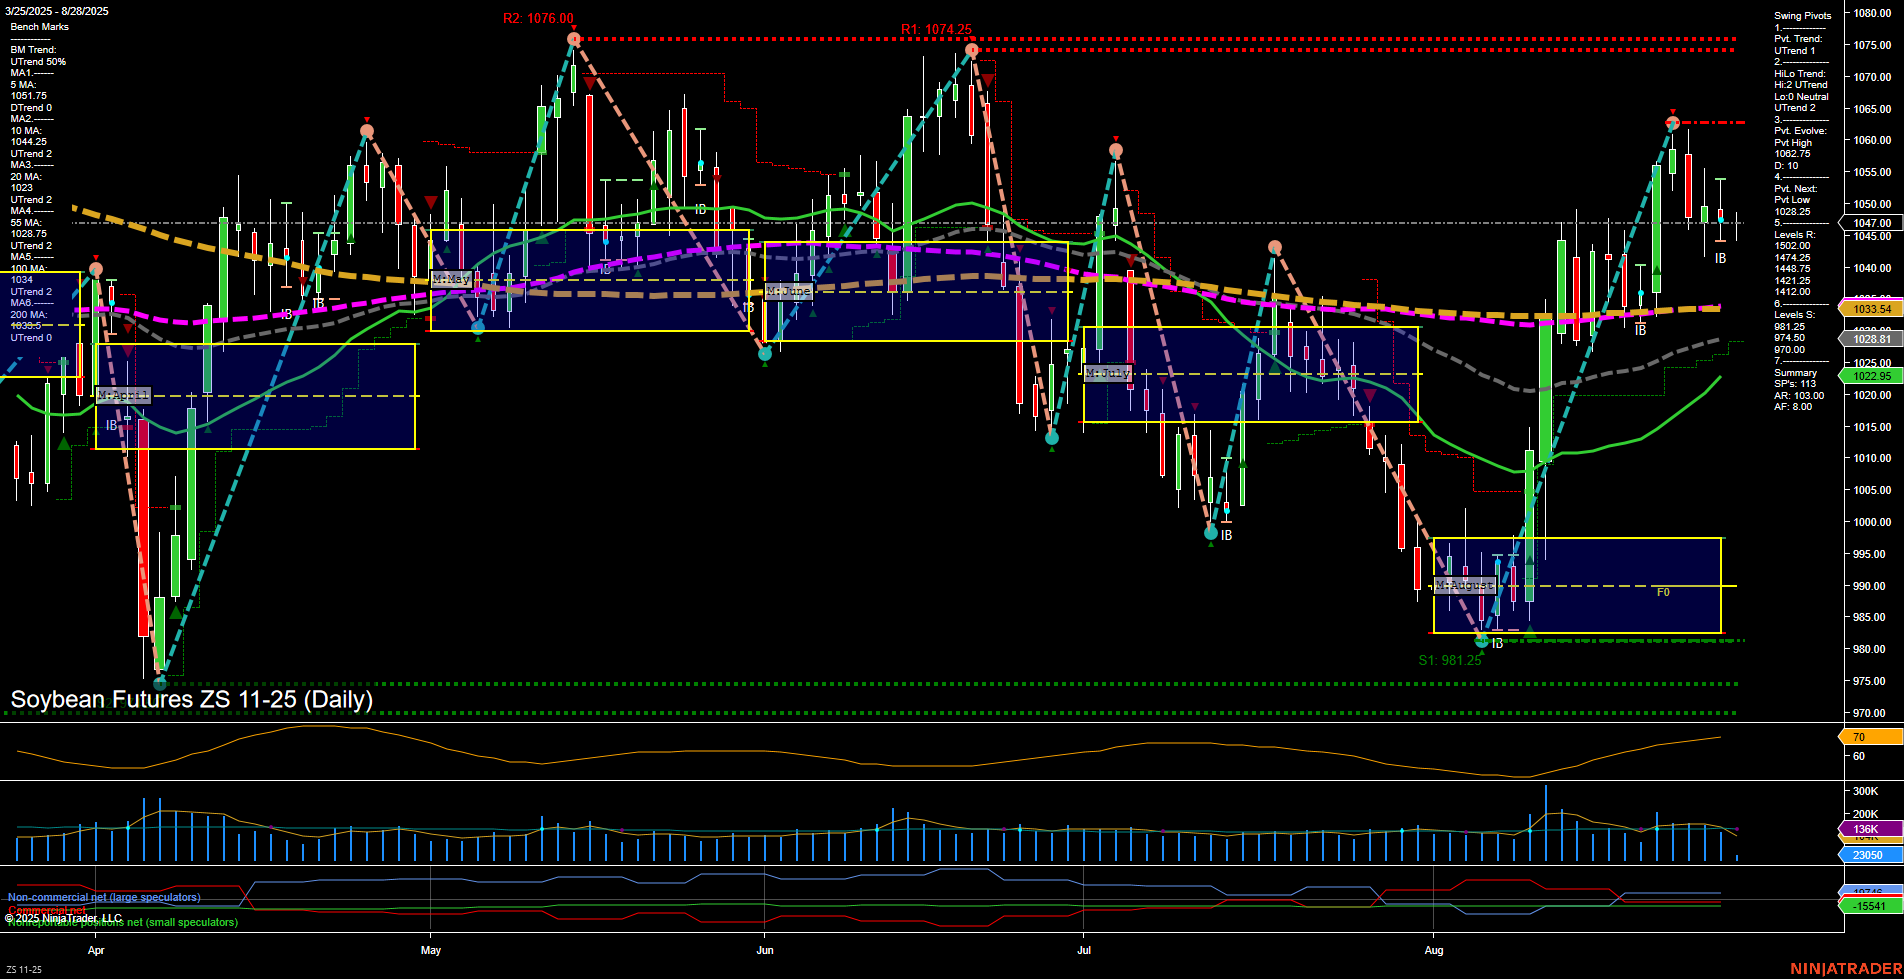
Soybean futures are currently in a transition phase, with mixed signals across timeframes. The short-term trend is neutral, as price action is consolidating near the 1047.00 level, with medium-sized bars and average momentum. The weekly session fib grid (WSFG) shows a downtrend, with price below the NTZ, indicating short-term weakness. However, the monthly session fib grid (MSFG) and yearly session fib grid (YSFG) both show price above their respective NTZs, supporting an intermediate- and long-term uptrend bias. Swing pivots confirm an uptrend in both short- and intermediate-term, with the most recent pivot high at 1060.75 and next potential support at 1028.25. Resistance is layered above at 1060.75, 1074.25, and 1076.00, while support is found at 1028.25, 1014.75, 1003.50, and 981.25. Moving averages are mixed: the 5-day MA is trending down, while the 10- and 20-day MAs are up, but the 55-, 100-, and 200-day MAs remain in a downtrend, reflecting longer-term overhead pressure. ATR and volume metrics suggest moderate volatility and participation. Recent trade signals show both long and short entries in the past week, highlighting the choppy, range-bound nature of the current market. Overall, the market is consolidating after a recent rally, with intermediate-term bullishness but short-term indecision. Traders are watching for a breakout above resistance or a breakdown below support to confirm the next directional move.