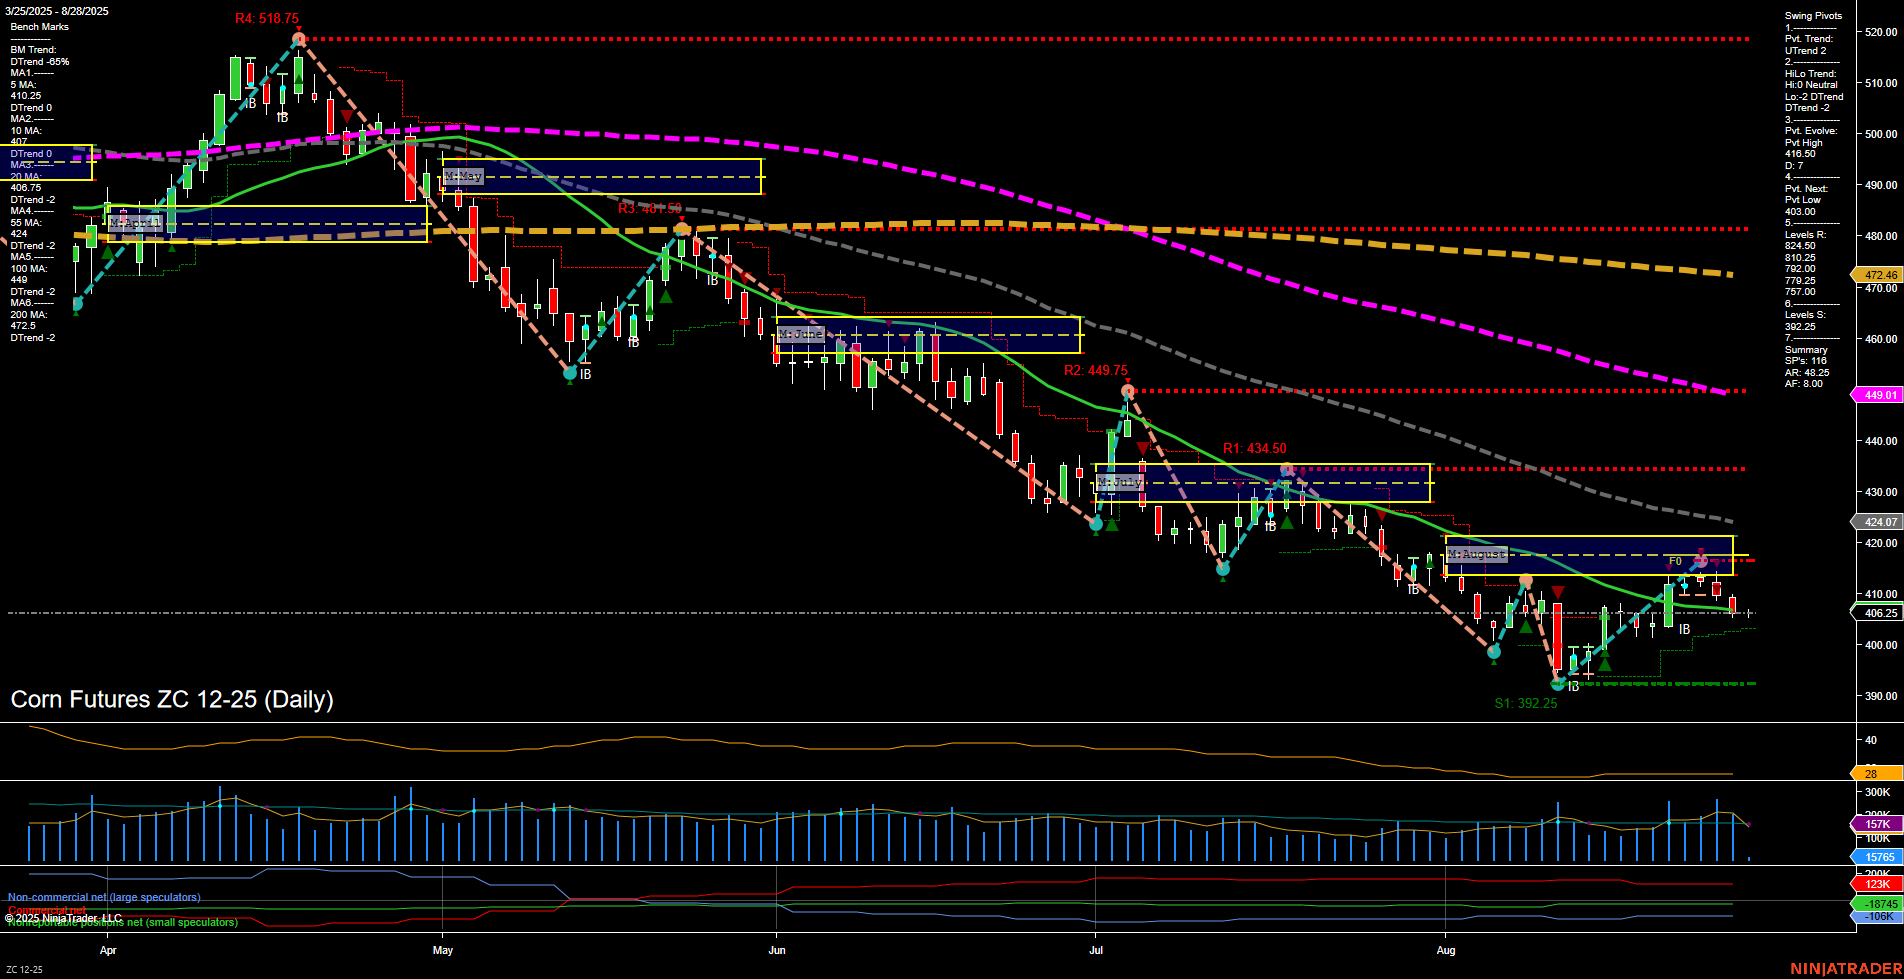
ZC Corn Futures Daily Chart Analysis: 2025-Aug-28 07:21 CT
Price Action
- Last: 406.25,
- Bars: Medium,
- Mom: Momentum slow.
WSFG Weekly
- Short-Term
- WSFG Current: -44%
- F0%/NTZ' Bias: Price Below,
- WSFG Trend: Down.
MSFG Month Aug
- Intermediate-Term
- MSFG Current: -34%
- F0%/NTZ' Bias: Price Below,
- MSFG Trend: Down.
YSFG Year 2025
- Long-Term
- YSFG Current: -57%
- F0%/NTZ' Bias: Price Below,
- YSFG Trend: Down.
Swing Pivots
- (Short-Term) 1. Pvt. Trend: DTrend,
- (Intermediate-Term) 2. HiLo Trend: DTrend,
- 3. Pvt. Evolve: Pvt High 416.50,
- 4. Pvt. Next: Pvt Low 403.00,
- 5. Levels R: 518.75, 449.75, 434.50,
- 6. Levels S: 392.25.
Daily Benchmarks
- (Short-Term) 5 Day: 410.25 Down Trend,
- (Short-Term) 10 Day: 410.25 Down Trend,
- (Intermediate-Term) 20 Day: 406.78 Up Trend,
- (Intermediate-Term) 55 Day: 424.07 Down Trend,
- (Long-Term) 100 Day: 449.01 Down Trend,
- (Long-Term) 200 Day: 472.46 Down Trend.
Additional Metrics
Recent Trade Signals
- 26 Aug 2025: Short ZC 12-25 @ 408.75 Signals.USAR.TR120
- 26 Aug 2025: Short ZC 12-25 @ 410.5 Signals.USAR-WSFG
Overall Rating
- Short-Term: Bearish,
- Intermediate-Term: Bearish,
- Long-Term: Bearish.
Key Insights Summary
Corn futures remain in a pronounced downtrend across all timeframes, with price action consistently below key session fib grid levels and major moving averages. The most recent swing pivot structure confirms a series of lower highs and lower lows, with resistance levels well above current price and only one significant support at 392.25. Both short-term and intermediate-term moving averages are trending down, with only the 20-day MA showing a minor upturn, likely reflecting a recent bounce rather than a trend reversal. Volatility, as measured by ATR, is moderate, and volume remains steady but not elevated, suggesting no capitulation or breakout. Recent short trade signals align with the prevailing bearish structure. The market is consolidating just above support after a minor retracement, but the overall technical landscape favors continued downside unless a strong reversal pattern emerges. No evidence of a trend change is present, and the market remains vulnerable to further declines.
Chart Analysis ATS AI Generated: 2025-08-28 07:21 for Informational use only, not trading advice. Terms and Risk Disclosure Copyright © 2025. Algo Trading Systems LLC.
