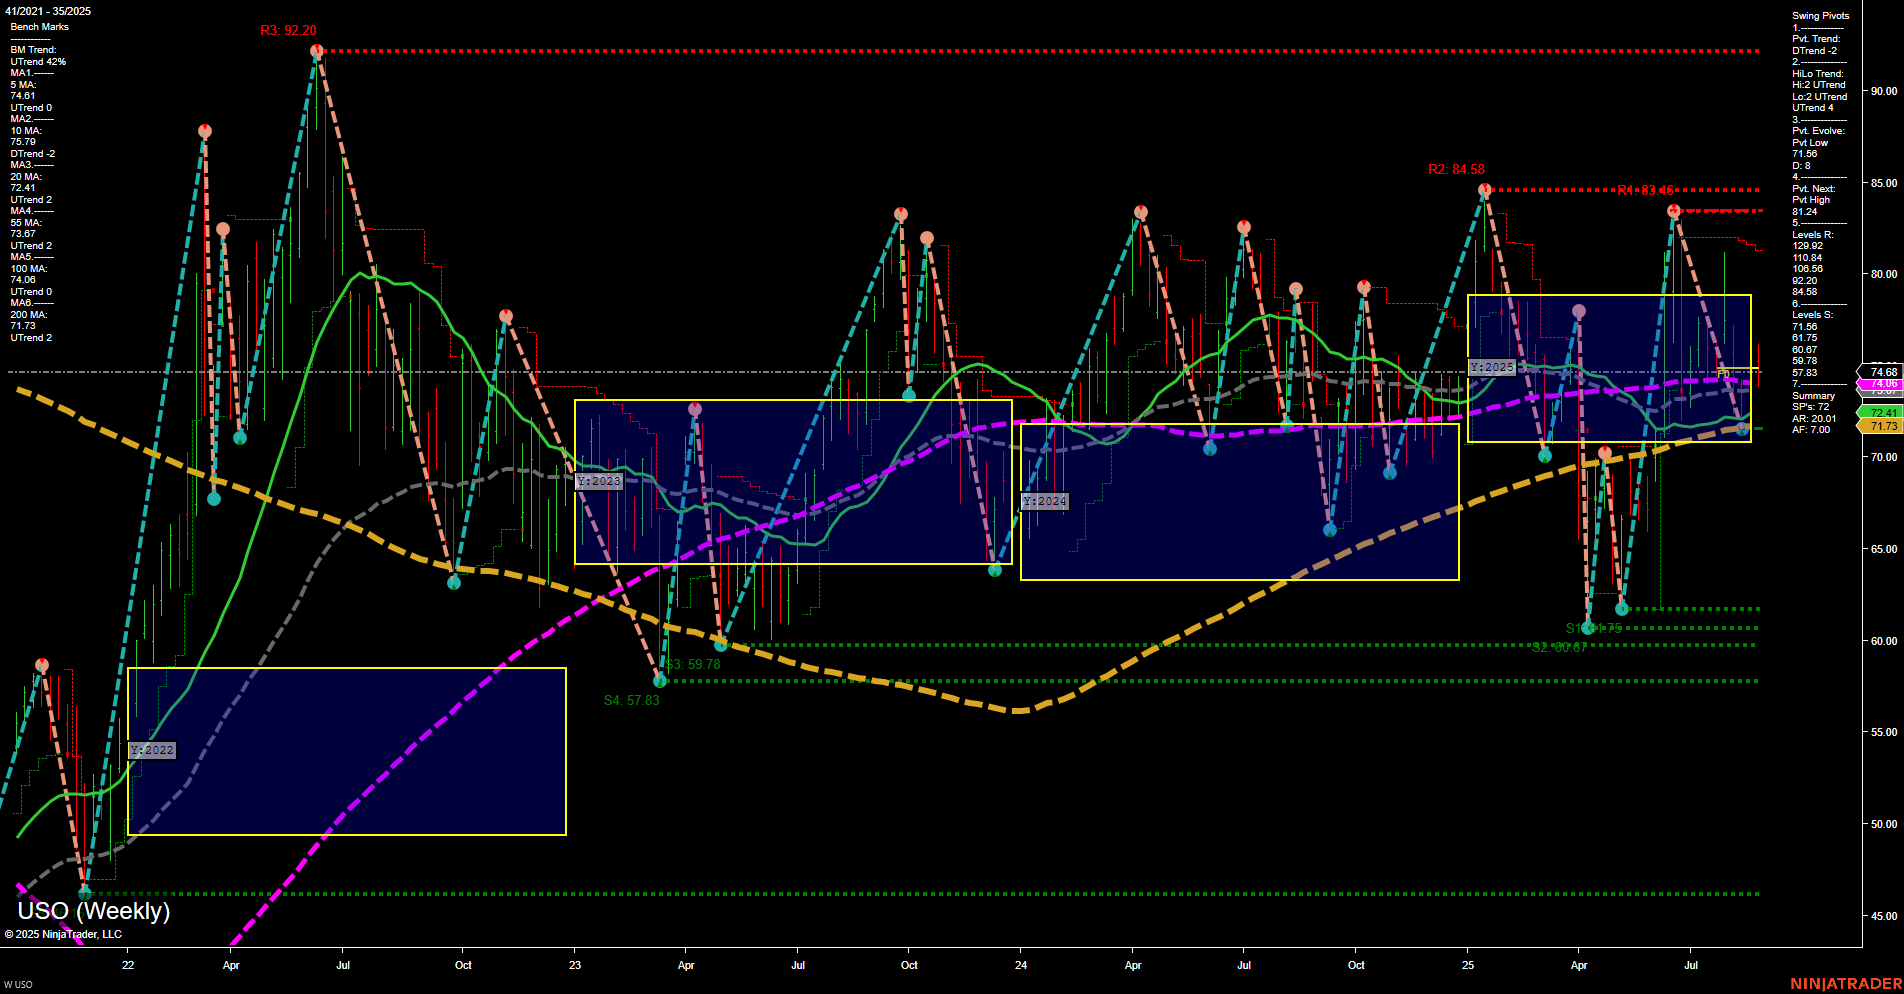
USO United States Oil Fund LP Weekly Chart Analysis: 2025-Aug-28 07:19 CT
Price Action
- Last: 74.68,
- Bars: Medium,
- Mom: Momentum slow.
WSFG Weekly
- Short-Term
- WSFG Current: NA%
- F0%/NTZ' Bias: Price Neutral,
- WSFG Trend: Neutral.
MSFG Month Aug
- Intermediate-Term
- MSFG Current: NA%
- F0%/NTZ' Bias: Price Neutral,
- MSFG Trend: Neutral.
YSFG Year 2025
- Long-Term
- YSFG Current: NA%
- F0%/NTZ' Bias: Price Neutral,
- YSFG Trend: Neutral.
Swing Pivots
- (Short-Term) 1. Pvt. Trend: DTrend,
- (Intermediate-Term) 2. HiLo Trend: UTrend,
- 3. Pvt. Evolve: Pvt Low 66.75,
- 4. Pvt. Next: Pvt High 81.24,
- 5. Levels R: 92.20, 84.58, 83.46, 81.24,
- 6. Levels S: 66.75, 60.67, 57.83.
Weekly Benchmarks
- (Intermediate-Term) 5 Week: 74.61 Down Trend,
- (Intermediate-Term) 10 Week: 72.41 Down Trend,
- (Long-Term) 20 Week: 71.13 Up Trend,
- (Long-Term) 55 Week: 74.06 Down Trend,
- (Long-Term) 100 Week: 77.73 Down Trend,
- (Long-Term) 200 Week: 71.73 Up Trend.
Overall Rating
- Short-Term: Bearish,
- Intermediate-Term: Neutral,
- Long-Term: Neutral.
Key Insights Summary
USO is currently trading in a broad consolidation range, with price action showing medium-sized bars and slow momentum, indicating a lack of strong directional conviction. The short-term swing pivot trend is down, supported by recent lower highs and a pivot low at 66.75, while the intermediate-term HiLo trend remains up, suggesting underlying support from previous higher lows. Key resistance levels are clustered between 81.24 and 92.20, with support at 66.75 and below. Most weekly moving averages are in a downtrend except for the 20 and 200-week, which are slightly up, reflecting a mixed long-term outlook. The neutral stance across the session fib grids (weekly, monthly, yearly) and the convergence of price near major moving averages reinforce a choppy, range-bound environment. This technical setup suggests the market is in a holding pattern, awaiting a catalyst for a decisive breakout or breakdown, with volatility likely to remain contained unless a significant move occurs through the established support or resistance levels.
Chart Analysis ATS AI Generated: 2025-08-28 07:19 for Informational use only, not trading advice. Terms and Risk Disclosure Copyright © 2025. Algo Trading Systems LLC.
