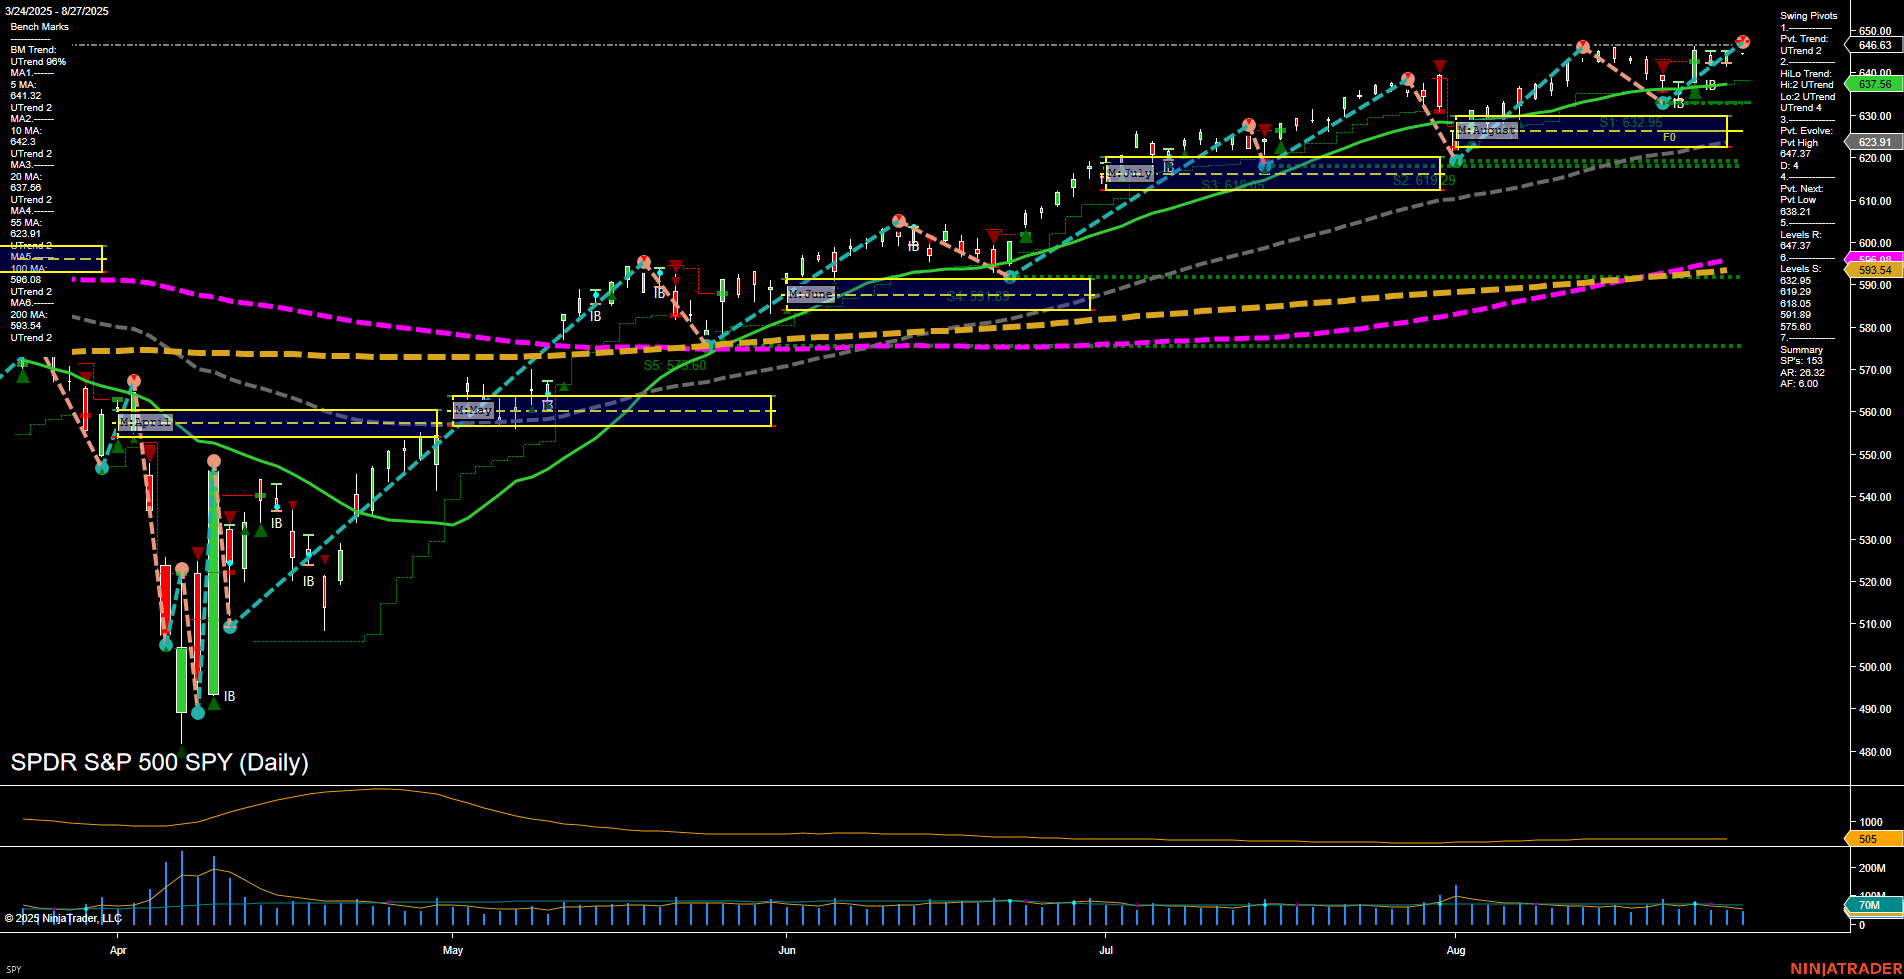
SPY SPDR S&P 500 Daily Chart Analysis: 2025-Aug-28 07:16 CT
Price Action
- Last: 646.63,
- Bars: Medium,
- Mom: Average.
WSFG Weekly
- Short-Term
- WSFG Current: NA%
- F0%/NTZ' Bias: Price Neutral,
- WSFG Trend: Neutral.
MSFG Month Aug
- Intermediate-Term
- MSFG Current: NA%
- F0%/NTZ' Bias: Price Neutral,
- MSFG Trend: Neutral.
YSFG Year 2025
- Long-Term
- YSFG Current: NA%
- F0%/NTZ' Bias: Price Neutral,
- YSFG Trend: Neutral.
Swing Pivots
- (Short-Term) 1. Pvt. Trend: UTrend,
- (Intermediate-Term) 2. HiLo Trend: UTrend,
- 3. Pvt. Evolve: Pvt High 647.37,
- 4. Pvt. Next: Pvt Low 635.21,
- 5. Levels R: 647.37, 639.31, 620.00,
- 6. Levels S: 637.56, 630.00, 619.08, 618.05, 617.50, 610.95.
Daily Benchmarks
- (Short-Term) 5 Day: 641.32 Up Trend,
- (Short-Term) 10 Day: 637.25 Up Trend,
- (Intermediate-Term) 20 Day: 637.56 Up Trend,
- (Intermediate-Term) 55 Day: 623.01 Up Trend,
- (Long-Term) 100 Day: 599.34 Up Trend,
- (Long-Term) 200 Day: 586.08 Up Trend.
Additional Metrics
Overall Rating
- Short-Term: Bullish,
- Intermediate-Term: Bullish,
- Long-Term: Bullish.
Key Insights Summary
The SPY daily chart shows a strong bullish structure across all timeframes, with price action maintaining higher highs and higher lows. The current swing pivot trend is up, and both short-term and intermediate-term HiLo trends confirm upward momentum. All benchmark moving averages (from 5-day to 200-day) are in uptrends, supporting a sustained bullish environment. Resistance is layered just above the current price, with the most immediate at 647.37, while support is well-defined below, starting at 637.56 and extending down to the 610s. ATR and volume metrics indicate moderate volatility and healthy participation. The market appears to be in a trend continuation phase, with no immediate signs of reversal or exhaustion, and price is consolidating near recent highs after a series of upward swings. This environment is favorable for trend-following strategies, with the potential for further upside if resistance levels are cleared.
Chart Analysis ATS AI Generated: 2025-08-28 07:17 for Informational use only, not trading advice. Terms and Risk Disclosure Copyright © 2025. Algo Trading Systems LLC.
