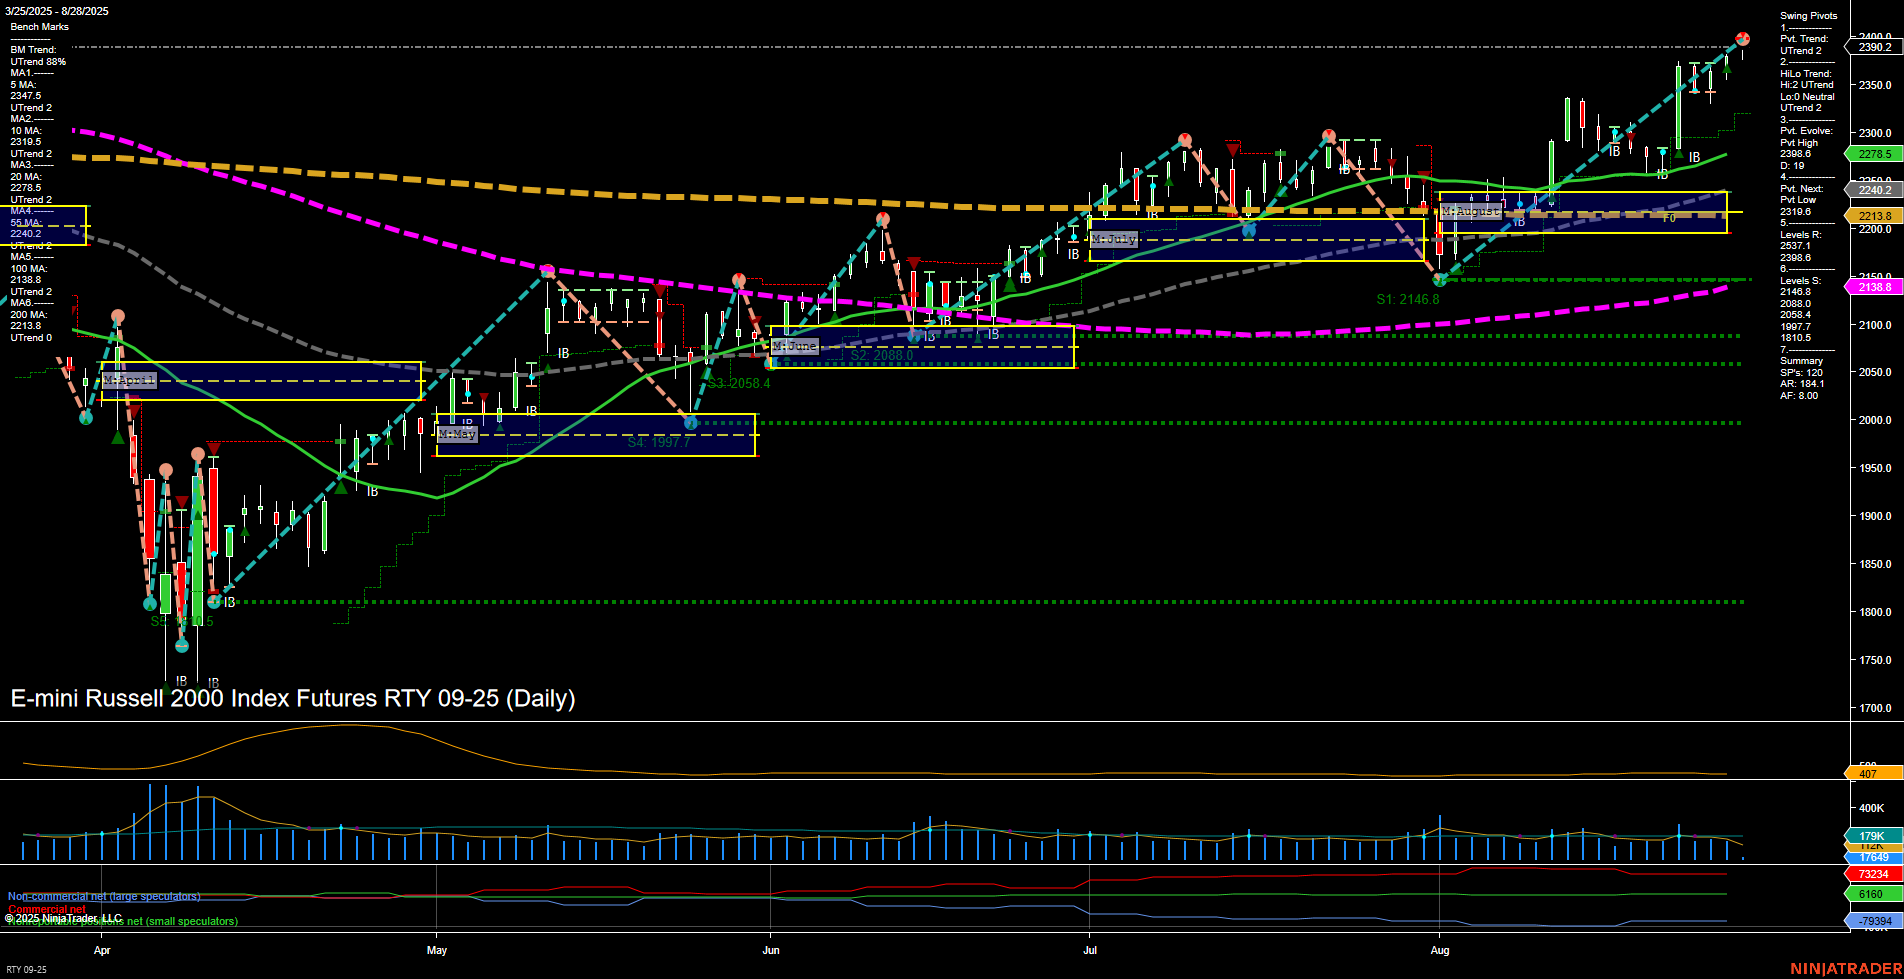
RTY E-mini Russell 2000 Index Futures Daily Chart Analysis: 2025-Aug-28 07:15 CT
Price Action
- Last: 2390.2,
- Bars: Medium,
- Mom: Average.
WSFG Weekly
- Short-Term
- WSFG Current: 19%
- F0%/NTZ' Bias: Price Above,
- WSFG Trend: Up.
MSFG Month Aug
- Intermediate-Term
- MSFG Current: 134%
- F0%/NTZ' Bias: Price Above,
- MSFG Trend: Up.
YSFG Year 2025
- Long-Term
- YSFG Current: 17%
- F0%/NTZ' Bias: Price Above,
- YSFG Trend: Up.
Swing Pivots
- (Short-Term) 1. Pvt. Trend: UTrend,
- (Intermediate-Term) 2. HiLo Trend: UTrend,
- 3. Pvt. Evolve: Pvt High 2389.6,
- 4. Pvt. Next: Pvt Low 2240.0,
- 5. Levels R: 2390.2, 2389.6, 2318.8,
- 6. Levels S: 2240.0, 2213.8, 2146.8.
Daily Benchmarks
- (Short-Term) 5 Day: 2347.1 Up Trend,
- (Short-Term) 10 Day: 2310.5 Up Trend,
- (Intermediate-Term) 20 Day: 2278.5 Up Trend,
- (Intermediate-Term) 55 Day: 2213.8 Up Trend,
- (Long-Term) 100 Day: 2139.8 Up Trend,
- (Long-Term) 200 Day: 2240.2 Up Trend.
Additional Metrics
Recent Trade Signals
- 28 Aug 2025: Long RTY 09-25 @ 2389.9 Signals.USAR-WSFG
- 26 Aug 2025: Long RTY 09-25 @ 2365.7 Signals.USAR.TR120
Overall Rating
- Short-Term: Bullish,
- Intermediate-Term: Bullish,
- Long-Term: Bullish.
Key Insights Summary
The RTY E-mini Russell 2000 is exhibiting a strong bullish structure across all timeframes. Price is trading above all key moving averages, with each benchmark MA in a confirmed uptrend, and the most recent swing pivot confirming a new high. The weekly, monthly, and yearly session fib grids all show price above their respective NTZ/F0% levels, reinforcing the upward momentum. Recent trade signals have triggered new long entries, and the ATR and volume metrics suggest healthy, sustained activity without excessive volatility. The market has been making higher highs and higher lows, with resistance levels being tested and surpassed, and support levels rising accordingly. This environment is characteristic of a trending market, with momentum favoring further upside as long as current support levels hold. No signs of major reversal or exhaustion are present, and the technical landscape supports a continuation of the prevailing uptrend.
Chart Analysis ATS AI Generated: 2025-08-28 07:15 for Informational use only, not trading advice. Terms and Risk Disclosure Copyright © 2025. Algo Trading Systems LLC.
