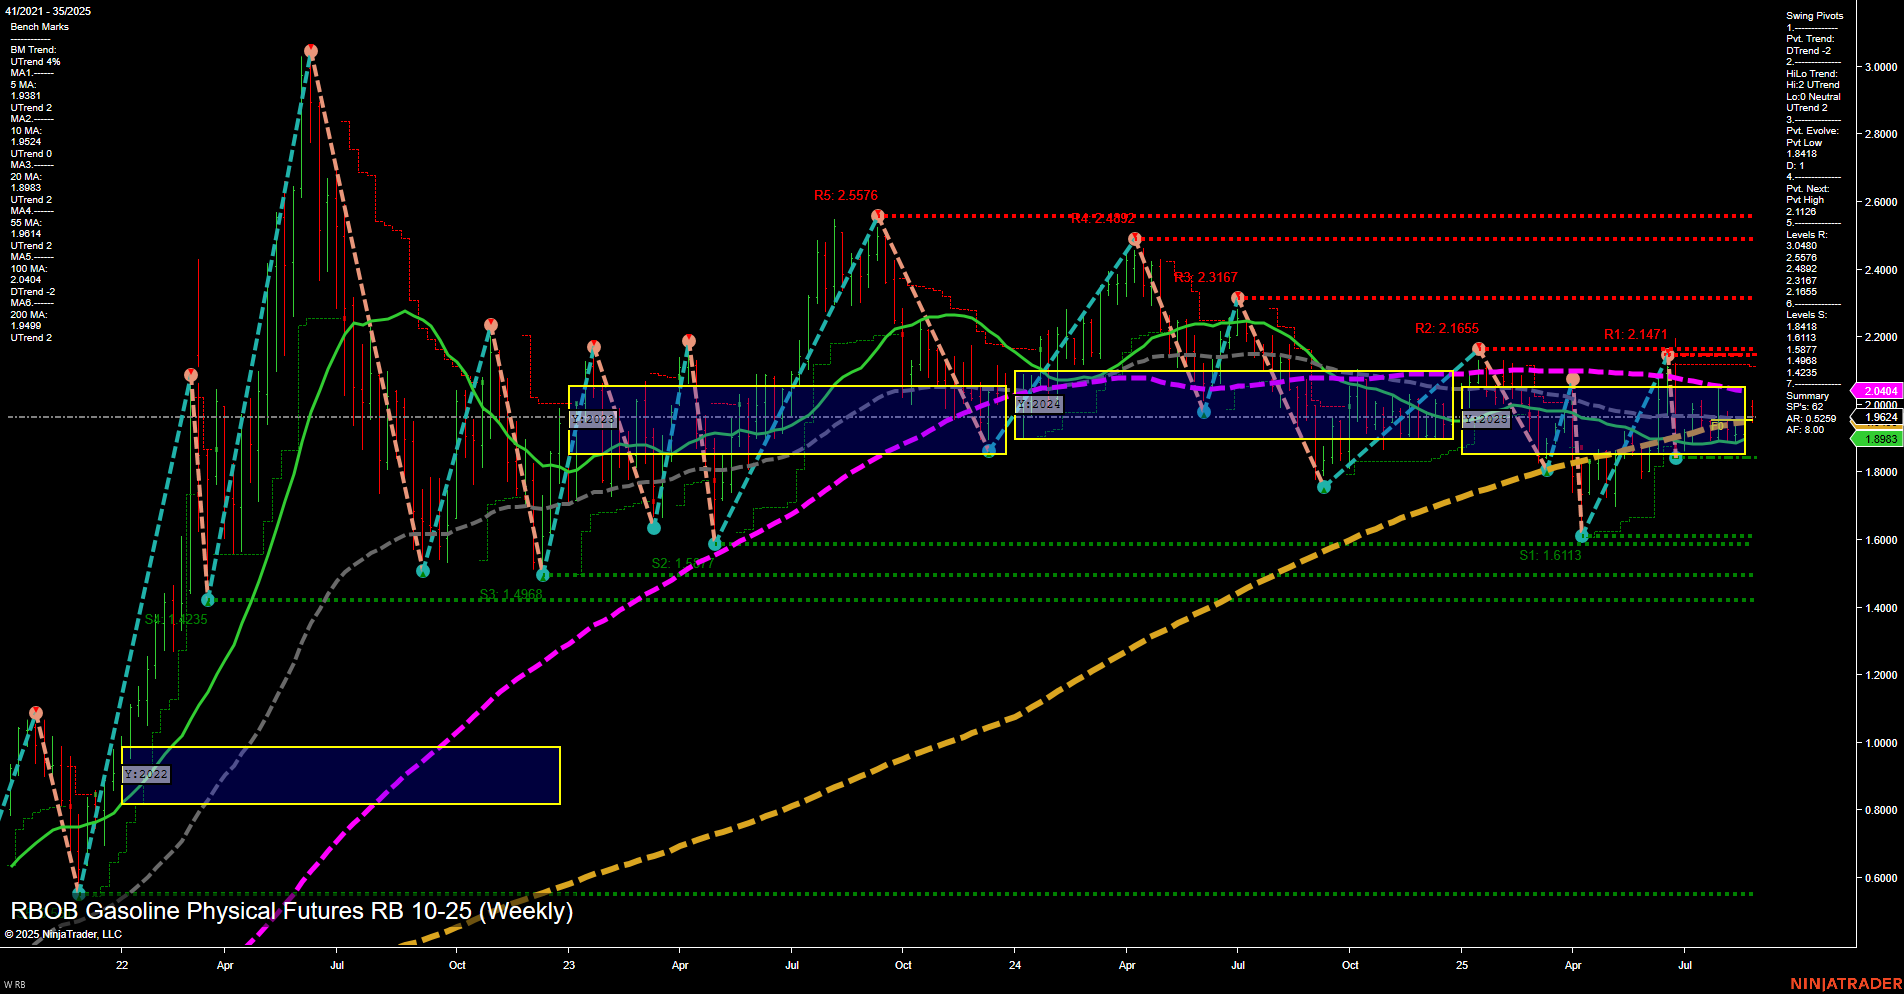
RB RBOB Gasoline Physical Futures Weekly Chart Analysis: 2025-Aug-28 07:14 CT
Price Action
- Last: 1.9536,
- Bars: Medium,
- Mom: Momentum slow.
WSFG Weekly
- Short-Term
- WSFG Current: -34%
- F0%/NTZ' Bias: Price Below,
- WSFG Trend: Down.
MSFG Month Aug
- Intermediate-Term
- MSFG Current: -20%
- F0%/NTZ' Bias: Price Below,
- MSFG Trend: Down.
YSFG Year 2025
- Long-Term
- YSFG Current: 1%
- F0%/NTZ' Bias: Price Above,
- YSFG Trend: Up.
Swing Pivots
- (Short-Term) 1. Pvt. Trend: DTrend,
- (Intermediate-Term) 2. HiLo Trend: UTrend,
- 3. Pvt. Evolve: Pvt low 1.8418,
- 4. Pvt. Next: Pvt high 2.1128,
- 5. Levels R: 2.5576, 2.4892, 2.3167, 2.1655, 2.1471,
- 6. Levels S: 1.6113, 1.4205, 1.4235.
Weekly Benchmarks
- (Intermediate-Term) 5 Week: 1.9381 Down Trend,
- (Intermediate-Term) 10 Week: 1.9624 Down Trend,
- (Long-Term) 20 Week: 1.9883 Down Trend,
- (Long-Term) 55 Week: 2.0404 Down Trend,
- (Long-Term) 100 Week: 2.0604 Down Trend,
- (Long-Term) 200 Week: 1.8993 Up Trend.
Recent Trade Signals
- 28 Aug 2025: Short RB 10-25 @ 1.9536 Signals.USAR-MSFG
- 26 Aug 2025: Short RB 10-25 @ 1.9633 Signals.USAR.TR120
- 26 Aug 2025: Short RB 10-25 @ 1.9827 Signals.USAR-WSFG
Overall Rating
- Short-Term: Bearish,
- Intermediate-Term: Bearish,
- Long-Term: Neutral.
Key Insights Summary
The RBOB Gasoline futures market is currently exhibiting a bearish tone in both the short- and intermediate-term timeframes, as indicated by the downward trends in the WSFG and MSFG grids, as well as the recent short trade signals. Price is trading below the NTZ center on both the weekly and monthly session grids, reinforcing the downside bias. The short-term swing pivot trend is down, while the intermediate-term HiLo trend remains up, suggesting some underlying support but with prevailing downward momentum. All key moving averages from 5 to 100 weeks are trending down, except for the 200-week, which is still up, indicating that the longer-term structure is more neutral and possibly in transition. Resistance levels are clustered above 2.14, while support is found near 1.61 and 1.42, with the most recent pivot low at 1.8418. The market appears to be in a corrective or consolidative phase within a broader range, with slow momentum and medium-sized bars reflecting a lack of strong directional conviction. This environment may be influenced by seasonal factors, recent volatility, and a potential shift in the longer-term trend if support levels are tested or broken.
Chart Analysis ATS AI Generated: 2025-08-28 07:15 for Informational use only, not trading advice. Terms and Risk Disclosure Copyright © 2025. Algo Trading Systems LLC.
