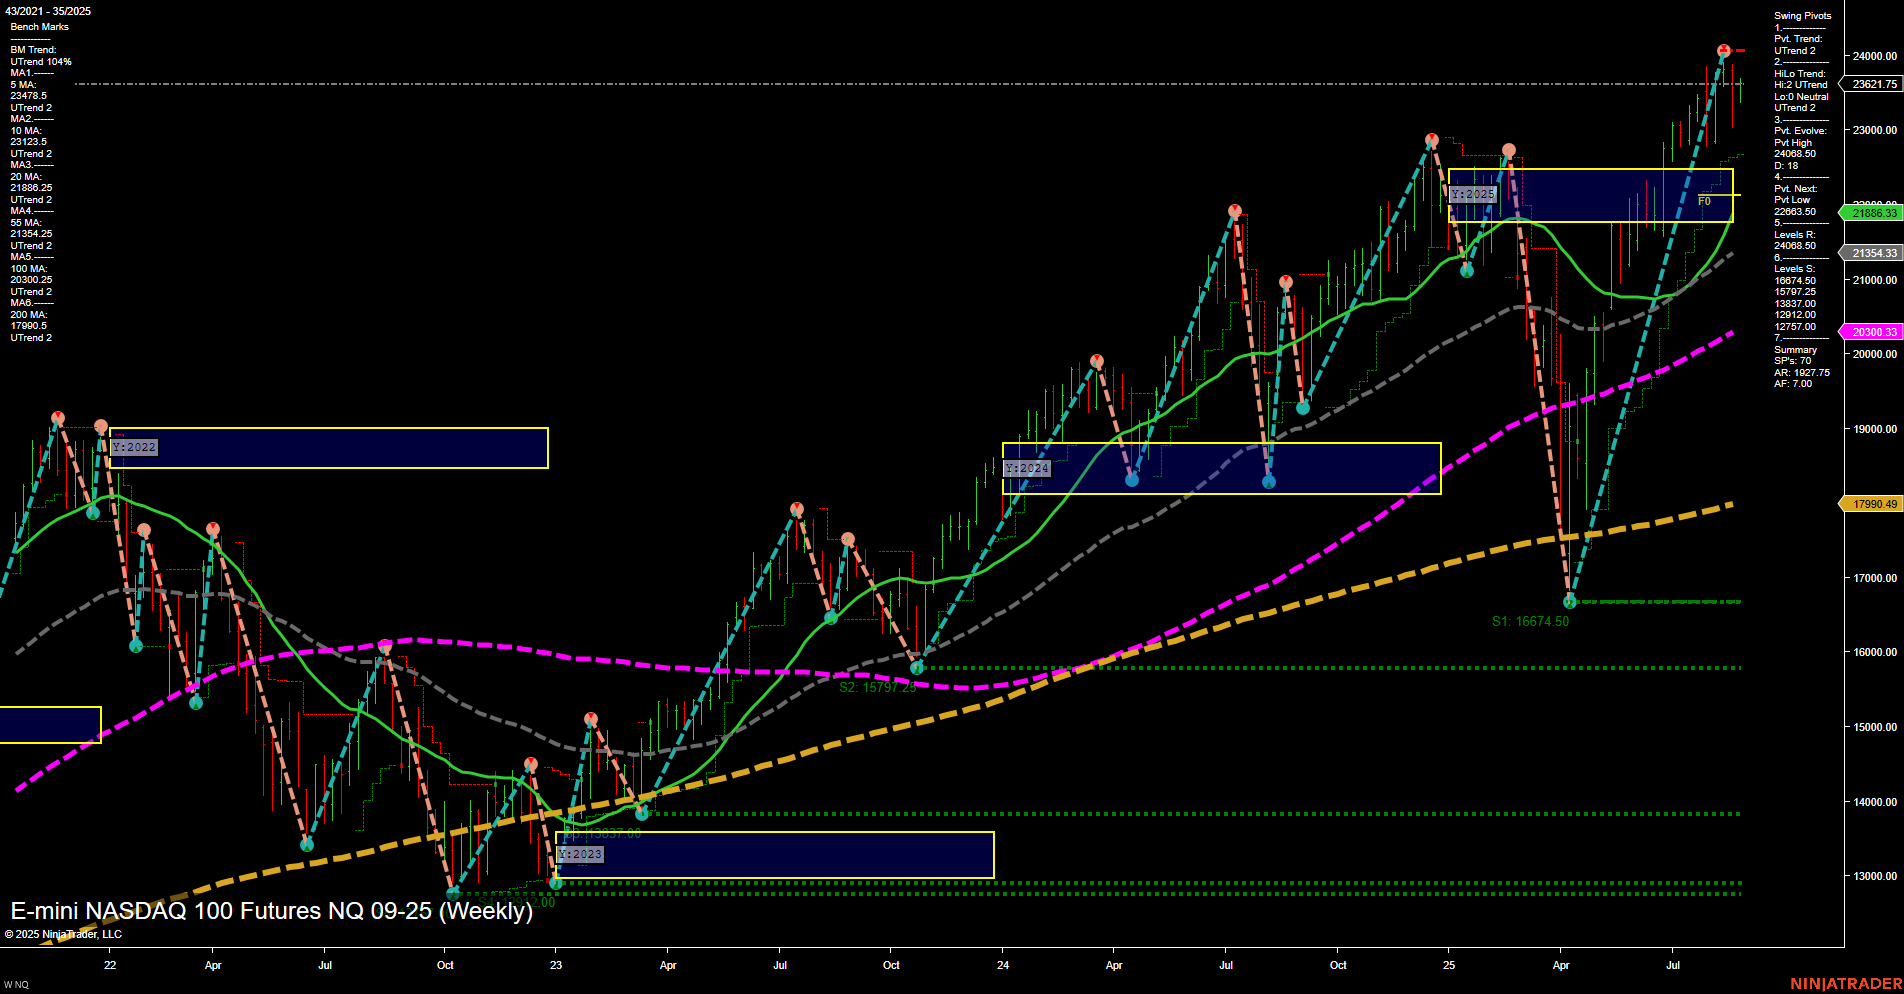
NQ E-mini NASDAQ 100 Futures Weekly Chart Analysis: 2025-Aug-28 07:13 CT
Price Action
- Last: 23621.75,
- Bars: Medium,
- Mom: Momentum average.
WSFG Weekly
- Short-Term
- WSFG Current: 2%
- F0%/NTZ' Bias: Price Above,
- WSFG Trend: Up.
MSFG Month Aug
- Intermediate-Term
- MSFG Current: 21%
- F0%/NTZ' Bias: Price Above,
- MSFG Trend: Up.
YSFG Year 2025
- Long-Term
- YSFG Current: 42%
- F0%/NTZ' Bias: Price Above,
- YSFG Trend: Up.
Swing Pivots
- (Short-Term) 1. Pvt. Trend: UTrend,
- (Intermediate-Term) 2. HiLo Trend: UTrend,
- 3. Pvt. Evolve: Pvt high 24003.50,
- 4. Pvt. Next: Pvt low 22053.50,
- 5. Levels R: 24003.50, 23621.75, 21000.00,
- 6. Levels S: 16674.50, 15797.75, 12777.00.
Weekly Benchmarks
- (Intermediate-Term) 5 Week: 21886.33 Up Trend,
- (Intermediate-Term) 10 Week: 21354.33 Up Trend,
- (Long-Term) 20 Week: 20303.33 Up Trend,
- (Long-Term) 55 Week: 20000.00 Up Trend,
- (Long-Term) 100 Week: 17990.49 Up Trend,
- (Long-Term) 200 Week: 17990.49 Up Trend.
Recent Trade Signals
- 28 Aug 2025: Long NQ 09-25 @ 23631.25 Signals.USAR-MSFG
- 28 Aug 2025: Short NQ 09-25 @ 23507.75 Signals.USAR-WSFG
- 22 Aug 2025: Long NQ 09-25 @ 23606.25 Signals.USAR.TR120
Overall Rating
- Short-Term: Bullish,
- Intermediate-Term: Bullish,
- Long-Term: Bullish.
Key Insights Summary
The NQ E-mini NASDAQ 100 Futures weekly chart shows a strong bullish structure across all timeframes. Price is trading above all major moving averages, with each benchmark MA trending upward, confirming sustained momentum. The swing pivot structure highlights a recent pivot high at 24003.50, with the next significant support at 22053.50, indicating a healthy distance between current price and key support. The Fib grid levels (WSFG, MSFG, YSFG) all show price above their respective NTZ/F0% lines, reinforcing the uptrend bias. Recent trade signals reflect both long and short activity, but the prevailing trend remains upward, supported by both short- and intermediate-term swing pivots. The market has recovered from previous pullbacks, forming higher lows and higher highs, and is currently in a trend continuation phase. Volatility appears moderate, with no signs of major reversal or exhaustion. The technical landscape suggests a market in a strong uptrend, with buyers in control and no immediate threat from resistance levels.
Chart Analysis ATS AI Generated: 2025-08-28 07:13 for Informational use only, not trading advice. Terms and Risk Disclosure Copyright © 2025. Algo Trading Systems LLC.
