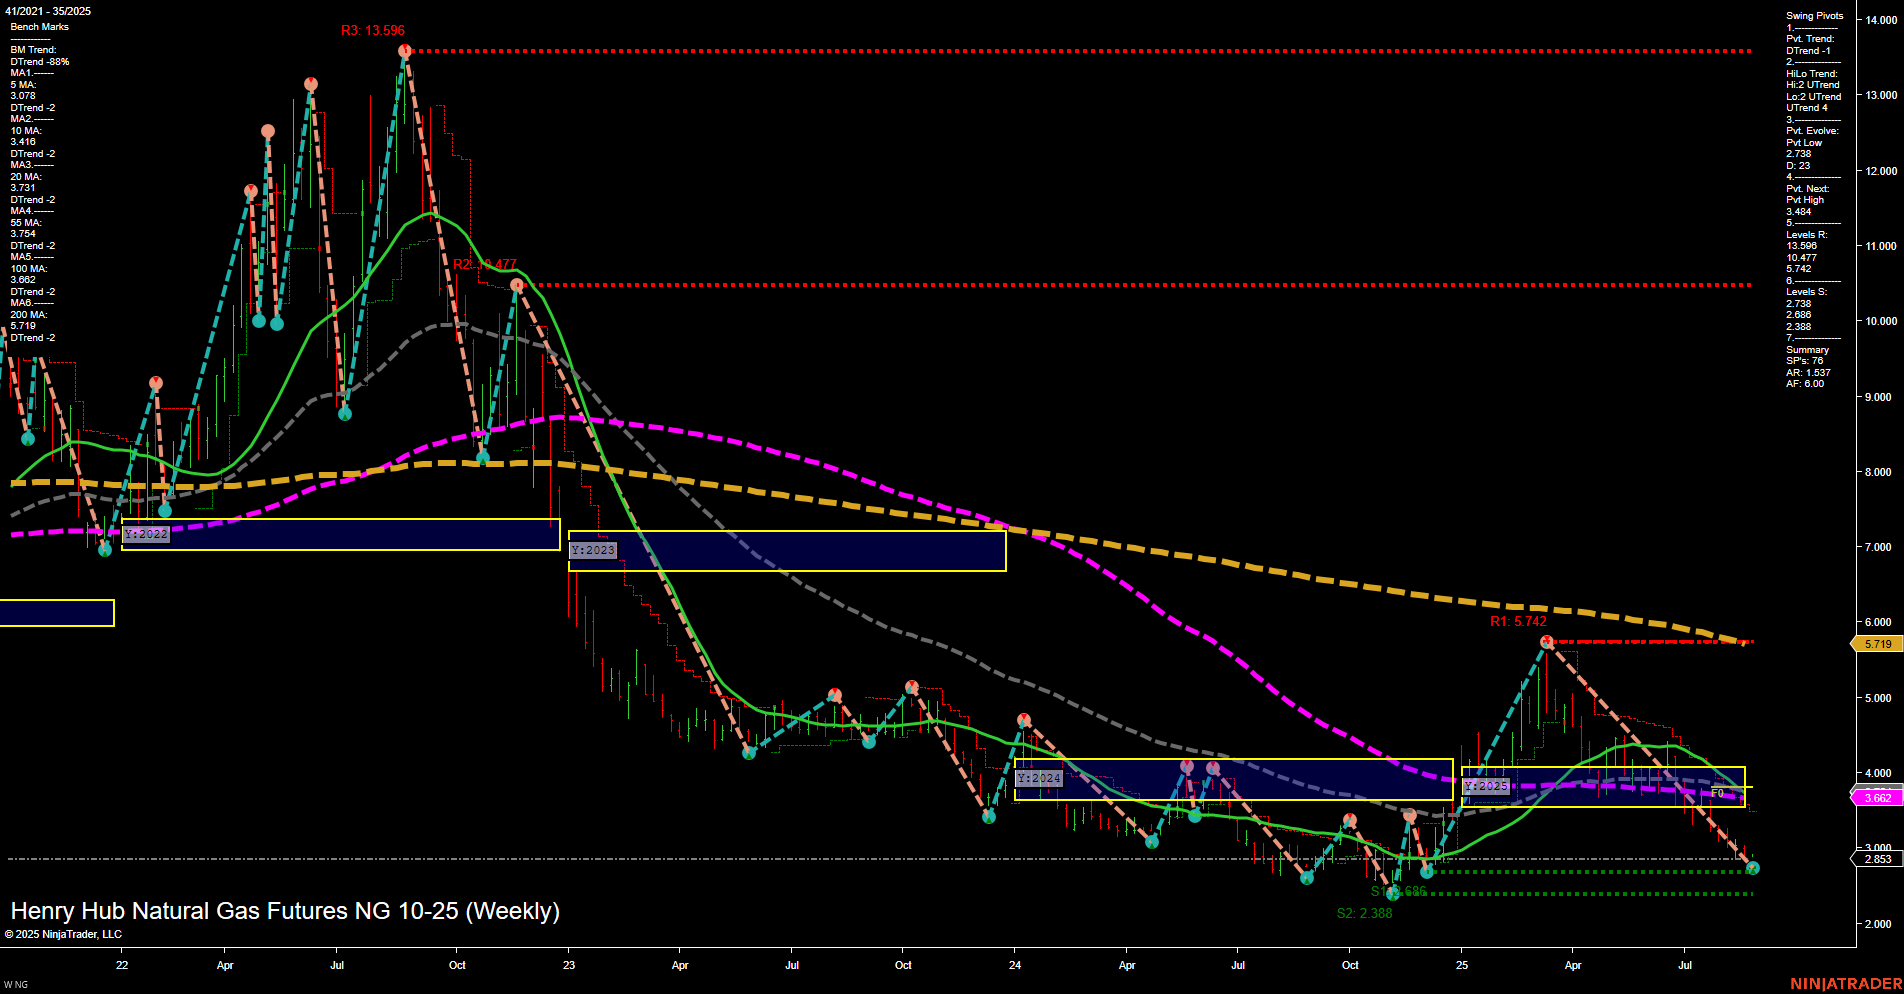
NG Henry Hub Natural Gas Futures Weekly Chart Analysis: 2025-Aug-28 07:11 CT
Price Action
- Last: 2.853,
- Bars: Medium,
- Mom: Momentum slow.
WSFG Weekly
- Short-Term
- WSFG Current: NA%
- F0%/NTZ' Bias: Price Neutral,
- WSFG Trend: Neutral.
MSFG Month Aug
- Intermediate-Term
- MSFG Current: NA%
- F0%/NTZ' Bias: Price Neutral,
- MSFG Trend: Neutral.
YSFG Year 2025
- Long-Term
- YSFG Current: NA%
- F0%/NTZ' Bias: Price Neutral,
- YSFG Trend: Neutral.
Swing Pivots
- (Short-Term) 1. Pvt. Trend: DTrend,
- (Intermediate-Term) 2. HiLo Trend: UTrend,
- 3. Pvt. Evolve: Pvt low 2.738,
- 4. Pvt. Next: Pvt high 3.84,
- 5. Levels R: 13.596, 10.477, 5.742,
- 6. Levels S: 2.738, 2.388, 2.288.
Weekly Benchmarks
- (Intermediate-Term) 5 Week: 3.078 Down Trend,
- (Intermediate-Term) 10 Week: 3.146 Down Trend,
- (Long-Term) 20 Week: 3.662 Down Trend,
- (Long-Term) 55 Week: 4.344 Down Trend,
- (Long-Term) 100 Week: 5.174 Down Trend,
- (Long-Term) 200 Week: 5.719 Down Trend.
Recent Trade Signals
- 27 Aug 2025: Long NG 10-25 @ 2.888 Signals.USAR.TR120
- 25 Aug 2025: Short NG 09-25 @ 2.655 Signals.USAR-WSFG
Overall Rating
- Short-Term: Bearish,
- Intermediate-Term: Neutral,
- Long-Term: Bearish.
Key Insights Summary
Natural gas futures remain under pressure, with price action showing a persistent downtrend across most timeframes. The last price of 2.853 is near recent swing lows, and momentum is slow, indicating a lack of strong buying interest. All major weekly moving averages (5, 10, 20, 55, 100, 200) are trending down, reinforcing the bearish long-term structure. The short-term swing pivot trend is down, while the intermediate-term HiLo trend is up, suggesting some divergence and potential for a technical bounce, but the overall structure remains weak. Key resistance levels are far above current price, while support is clustered just below, highlighting the risk of further downside if these levels break. Recent trade signals show mixed short-term activity, but the prevailing trend bias is bearish. The market is consolidating near multi-year lows, with no clear sign of reversal, and remains vulnerable to further declines unless a significant catalyst emerges.
Chart Analysis ATS AI Generated: 2025-08-28 07:12 for Informational use only, not trading advice. Terms and Risk Disclosure Copyright © 2025. Algo Trading Systems LLC.
