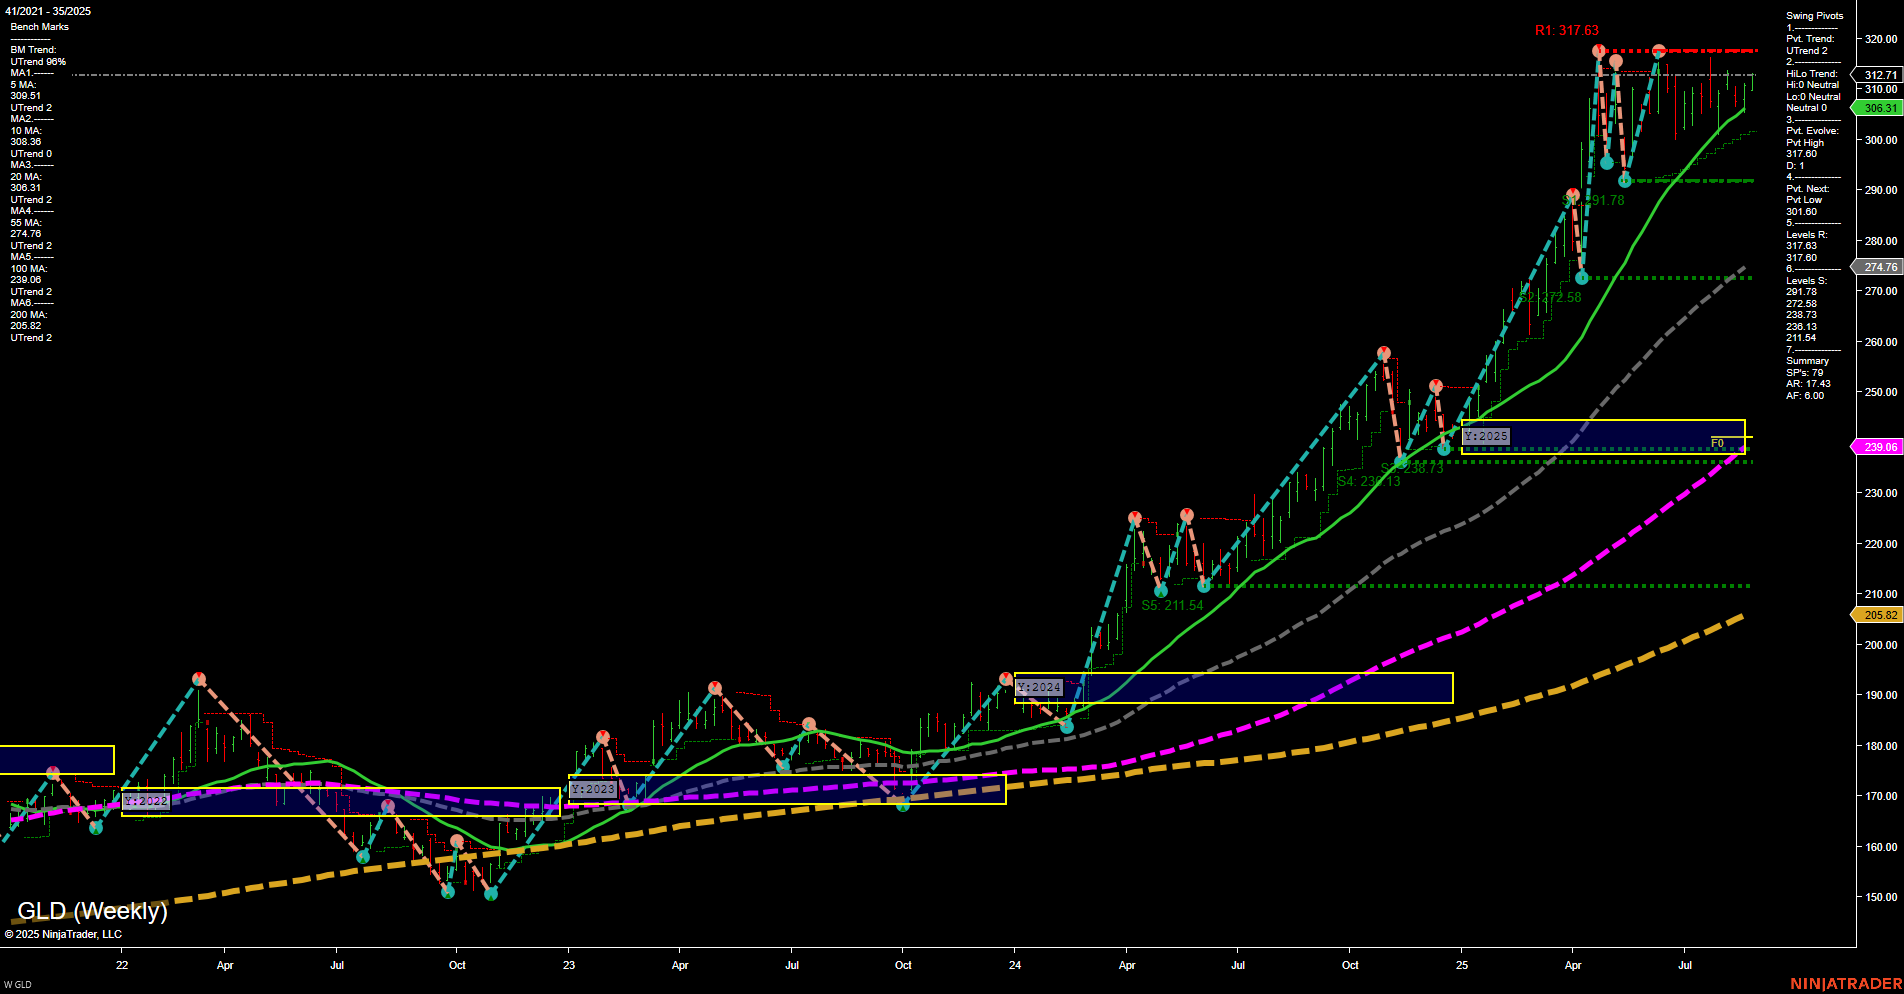
GLD SPDR Gold Shares Weekly Chart Analysis: 2025-Aug-28 07:11 CT
Price Action
- Last: 310.00,
- Bars: Medium,
- Mom: Momentum slow.
WSFG Weekly
- Short-Term
- WSFG Current: NA%
- F0%/NTZ' Bias: Price Neutral,
- WSFG Trend: Neutral.
MSFG Month Aug
- Intermediate-Term
- MSFG Current: NA%
- F0%/NTZ' Bias: Price Neutral,
- MSFG Trend: Neutral.
YSFG Year 2025
- Long-Term
- YSFG Current: NA%
- F0%/NTZ' Bias: Price Neutral,
- YSFG Trend: Neutral.
Swing Pivots
- (Short-Term) 1. Pvt. Trend: DTrend,
- (Intermediate-Term) 2. HiLo Trend: UTrend,
- 3. Pvt. Evolve: Pvt high 317.69,
- 4. Pvt. Next: Pvt low 301.60,
- 5. Levels R: 317.69, 312.17,
- 6. Levels S: 301.60, 274.76, 211.54.
Weekly Benchmarks
- (Intermediate-Term) 5 Week: 309.51 Up Trend,
- (Intermediate-Term) 10 Week: 308.86 Up Trend,
- (Long-Term) 20 Week: 303.13 Up Trend,
- (Long-Term) 55 Week: 274.76 Up Trend,
- (Long-Term) 100 Week: 239.08 Up Trend,
- (Long-Term) 200 Week: 205.82 Up Trend.
Overall Rating
- Short-Term: Neutral,
- Intermediate-Term: Bullish,
- Long-Term: Bullish.
Key Insights Summary
GLD is consolidating near all-time highs after a strong multi-month rally, with price action showing medium-sized bars and slow momentum. The short-term swing pivot trend has shifted to a minor downtrend, but the intermediate-term HiLo trend remains up, supported by a series of higher lows and strong support at 301.60. All key moving averages (5, 10, 20, 55, 100, 200 week) are trending upward, confirming a robust long-term bullish structure. Resistance is clustered at 312.17 and 317.69, with price repeatedly testing but not breaking out above these levels, indicating a potential range-bound or consolidation phase. Support is well-defined below, with the 20-week MA and previous swing lows providing a cushion. The overall technical structure suggests a pause or digestion phase within a larger uptrend, with the market awaiting a catalyst for the next directional move. No clear breakout or breakdown is evident, and the neutral bias in the short-term Fib grid aligns with this consolidation. The long-term uptrend remains intact, with the potential for renewed momentum if resistance is decisively cleared.
Chart Analysis ATS AI Generated: 2025-08-28 07:11 for Informational use only, not trading advice. Terms and Risk Disclosure Copyright © 2025. Algo Trading Systems LLC.
