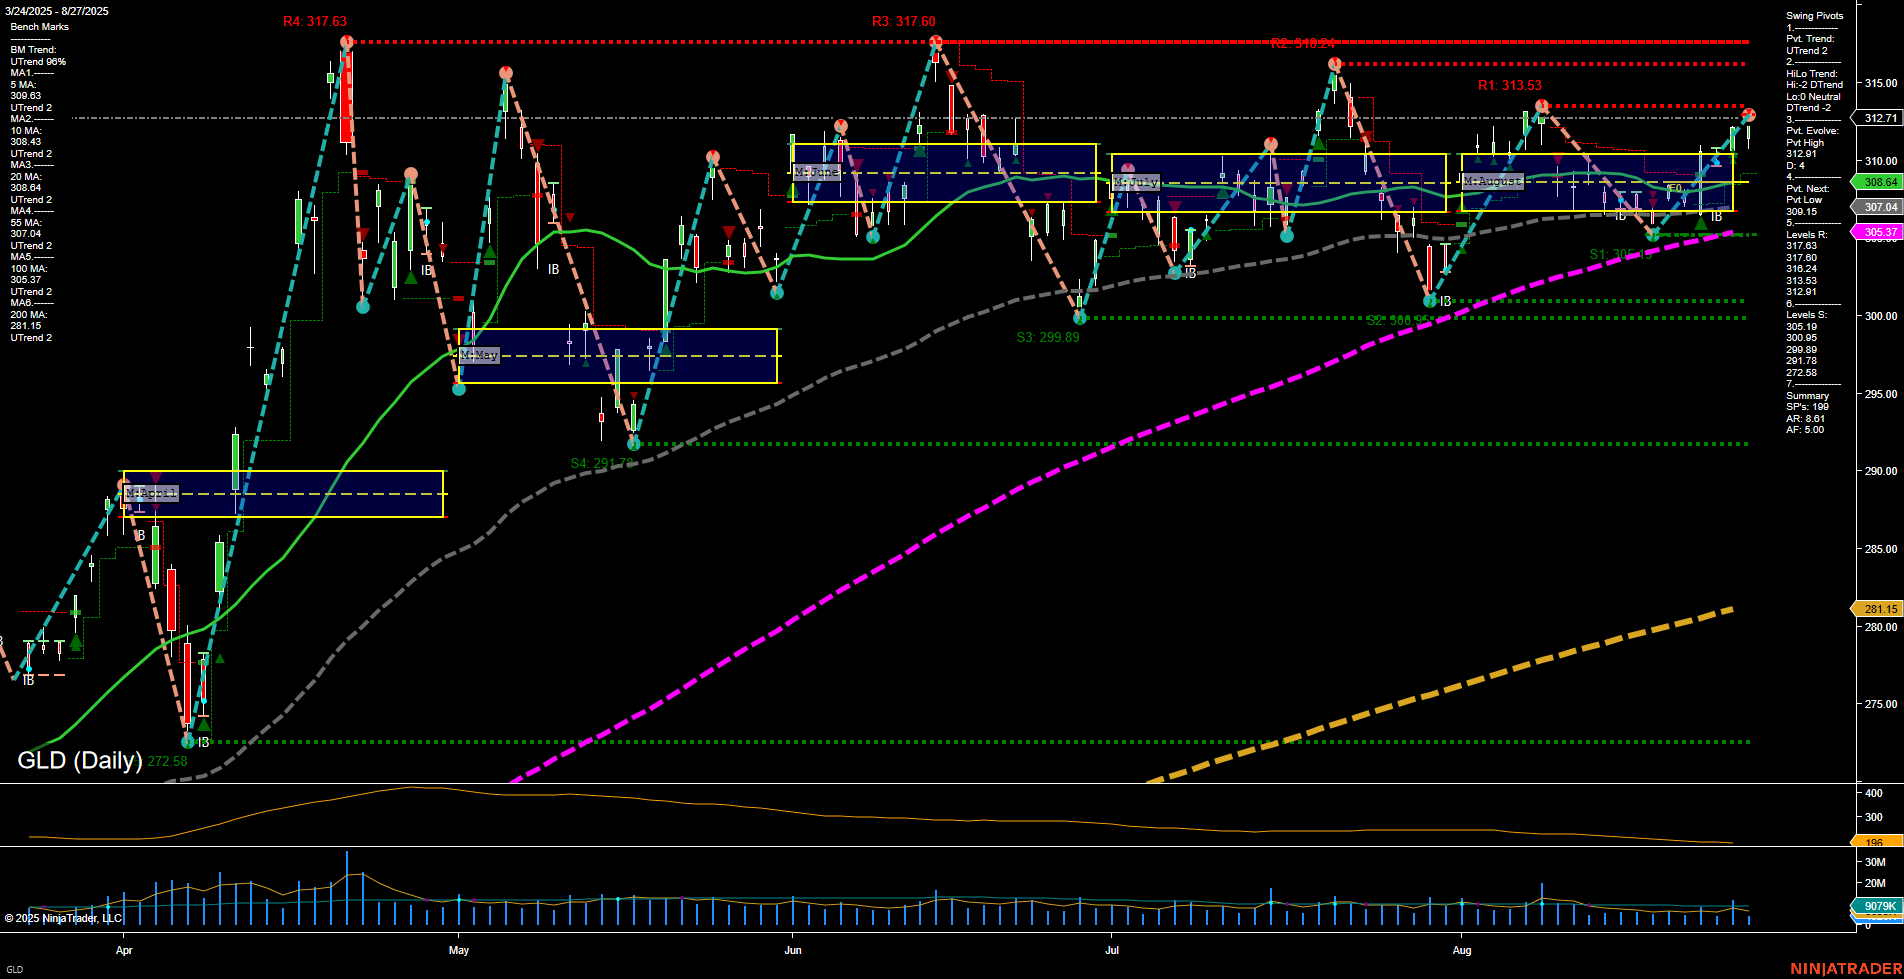
GLD SPDR Gold Shares Daily Chart Analysis: 2025-Aug-28 07:10 CT
Price Action
- Last: 312.71,
- Bars: Medium,
- Mom: Momentum average.
WSFG Weekly
- Short-Term
- WSFG Current: NA%
- F0%/NTZ' Bias: Price Neutral,
- WSFG Trend: Neutral.
MSFG Month Aug
- Intermediate-Term
- MSFG Current: NA%
- F0%/NTZ' Bias: Price Neutral,
- MSFG Trend: Neutral.
YSFG Year 2025
- Long-Term
- YSFG Current: NA%
- F0%/NTZ' Bias: Price Neutral,
- YSFG Trend: Neutral.
Swing Pivots
- (Short-Term) 1. Pvt. Trend: UTrend,
- (Intermediate-Term) 2. HiLo Trend: DTrend,
- 3. Pvt. Evolve: Pvt High 312.71,
- 4. Pvt. Next: Pvt Low 308.64,
- 5. Levels R: 317.63, 317.60, 313.53,
- 6. Levels S: 305.37, 300.85, 299.89, 291.78, 277.58.
Daily Benchmarks
- (Short-Term) 5 Day: 308.43 Up Trend,
- (Short-Term) 10 Day: 308.43 Up Trend,
- (Intermediate-Term) 20 Day: 307.04 Up Trend,
- (Intermediate-Term) 55 Day: 305.37 Up Trend,
- (Long-Term) 100 Day: 281.15 Up Trend,
- (Long-Term) 200 Day: 272.58 Up Trend.
Additional Metrics
Overall Rating
- Short-Term: Bullish,
- Intermediate-Term: Neutral,
- Long-Term: Bullish.
Key Insights Summary
GLD is currently showing a short-term bullish structure, with the latest price at 312.71 marking a new swing high and all benchmark moving averages trending upward. The short-term pivot trend is up, but the intermediate-term HiLo trend remains down, indicating some divergence and potential for choppy or range-bound action. Resistance is clustered near 313.53–317.63, while support is layered below at 305.37 and 300.85. ATR is elevated, reflecting moderate volatility, and volume is robust. The overall technical landscape suggests a market in transition, with bullish momentum in the short and long term, but intermediate-term signals are more neutral, hinting at possible consolidation or a pause before the next directional move. No clear breakout or breakdown is evident, and price is currently within a neutral monthly and weekly session grid context.
Chart Analysis ATS AI Generated: 2025-08-28 07:11 for Informational use only, not trading advice. Terms and Risk Disclosure Copyright © 2025. Algo Trading Systems LLC.
