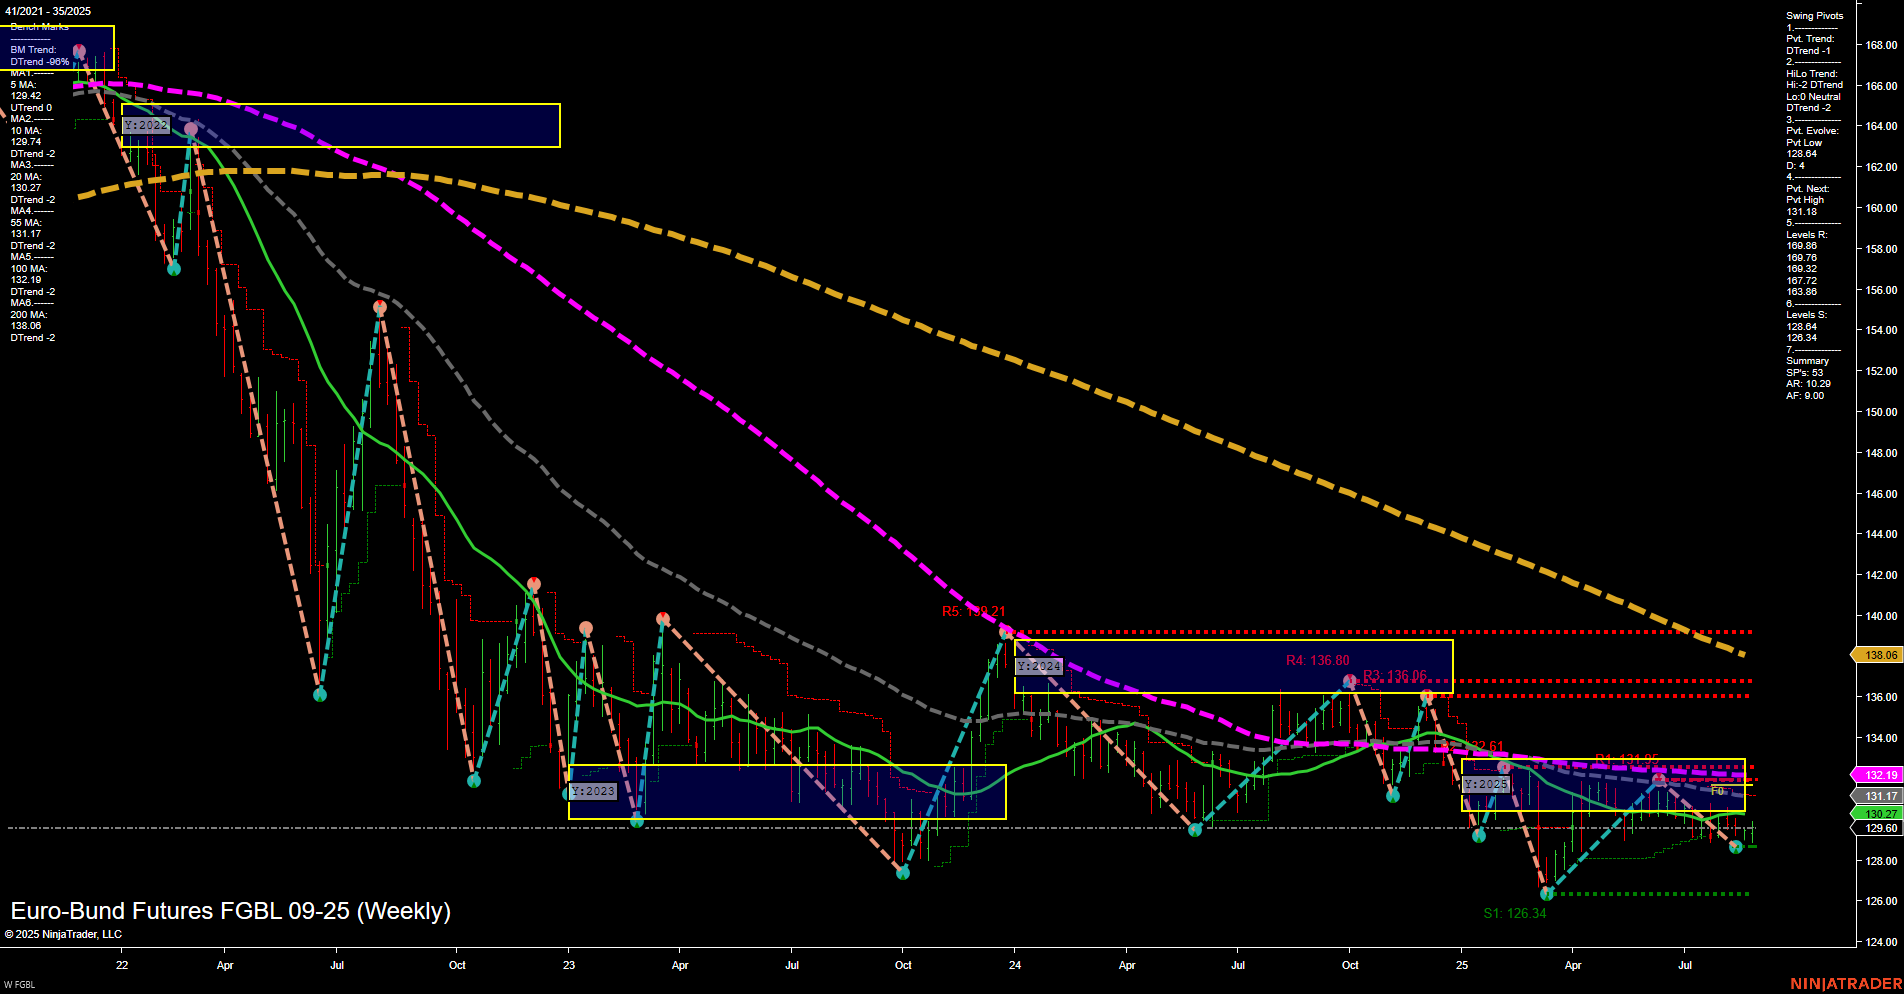
FGBL Euro-Bund Futures Weekly Chart Analysis: 2025-Aug-28 07:09 CT
Price Action
- Last: 129.86,
- Bars: Medium,
- Mom: Momentum average.
WSFG Weekly
- Short-Term
- WSFG Current: 28%
- F0%/NTZ' Bias: Price Above,
- WSFG Trend: Up.
MSFG Month Aug
- Intermediate-Term
- MSFG Current: 4%
- F0%/NTZ' Bias: Price Above,
- MSFG Trend: Up.
YSFG Year 2025
- Long-Term
- YSFG Current: -17%
- F0%/NTZ' Bias: Price Below,
- YSFG Trend: Down.
Swing Pivots
- (Short-Term) 1. Pvt. Trend: DTrend,
- (Intermediate-Term) 2. HiLo Trend: DTrend,
- 3. Pvt. Evolve: Pvt low 126.34,
- 4. Pvt. Next: Pvt high 131.18,
- 5. Levels R: 136.80, 136.06, 134.72, 133.87, 130.72,
- 6. Levels S: 128.84, 127.84, 126.34.
Weekly Benchmarks
- (Intermediate-Term) 5 Week: 129.44 Down Trend,
- (Intermediate-Term) 10 Week: 130.20 Down Trend,
- (Long-Term) 20 Week: 131.17 Down Trend,
- (Long-Term) 55 Week: 132.19 Down Trend,
- (Long-Term) 100 Week: 138.06 Down Trend,
- (Long-Term) 200 Week: 139.80 Down Trend.
Recent Trade Signals
- 28 Aug 2025: Long FGBL 09-25 @ 129.77 Signals.USAR-MSFG
- 26 Aug 2025: Long FGBL 09-25 @ 129.43 Signals.USAR-WSFG
- 26 Aug 2025: Long FGBL 09-25 @ 129.34 Signals.USAR.TR120
Overall Rating
- Short-Term: Neutral,
- Intermediate-Term: Neutral,
- Long-Term: Bearish.
Key Insights Summary
The FGBL Euro-Bund Futures weekly chart shows a market in transition. Price action is consolidating with medium-sized bars and average momentum, reflecting indecision after a recent swing low at 126.34. Short- and intermediate-term Fib grid trends have turned up, with price currently above their NTZ/F0% levels, but both swing pivot trends remain down, indicating that rallies are still being met with resistance. The next key resistance is at 131.18, with major resistance stacked above at 133.87–136.80, while support is clustered at 128.84 and 126.34. All benchmark moving averages from 5 to 200 weeks are trending down, confirming persistent long-term bearish pressure. Recent trade signals have triggered new longs, suggesting some short-term optimism, but the overall structure remains capped by significant overhead resistance and a dominant long-term downtrend. The market is in a corrective phase within a broader bearish cycle, with potential for further choppy, range-bound action unless a decisive breakout above the 131–133 zone occurs.
Chart Analysis ATS AI Generated: 2025-08-28 07:10 for Informational use only, not trading advice. Terms and Risk Disclosure Copyright © 2025. Algo Trading Systems LLC.
