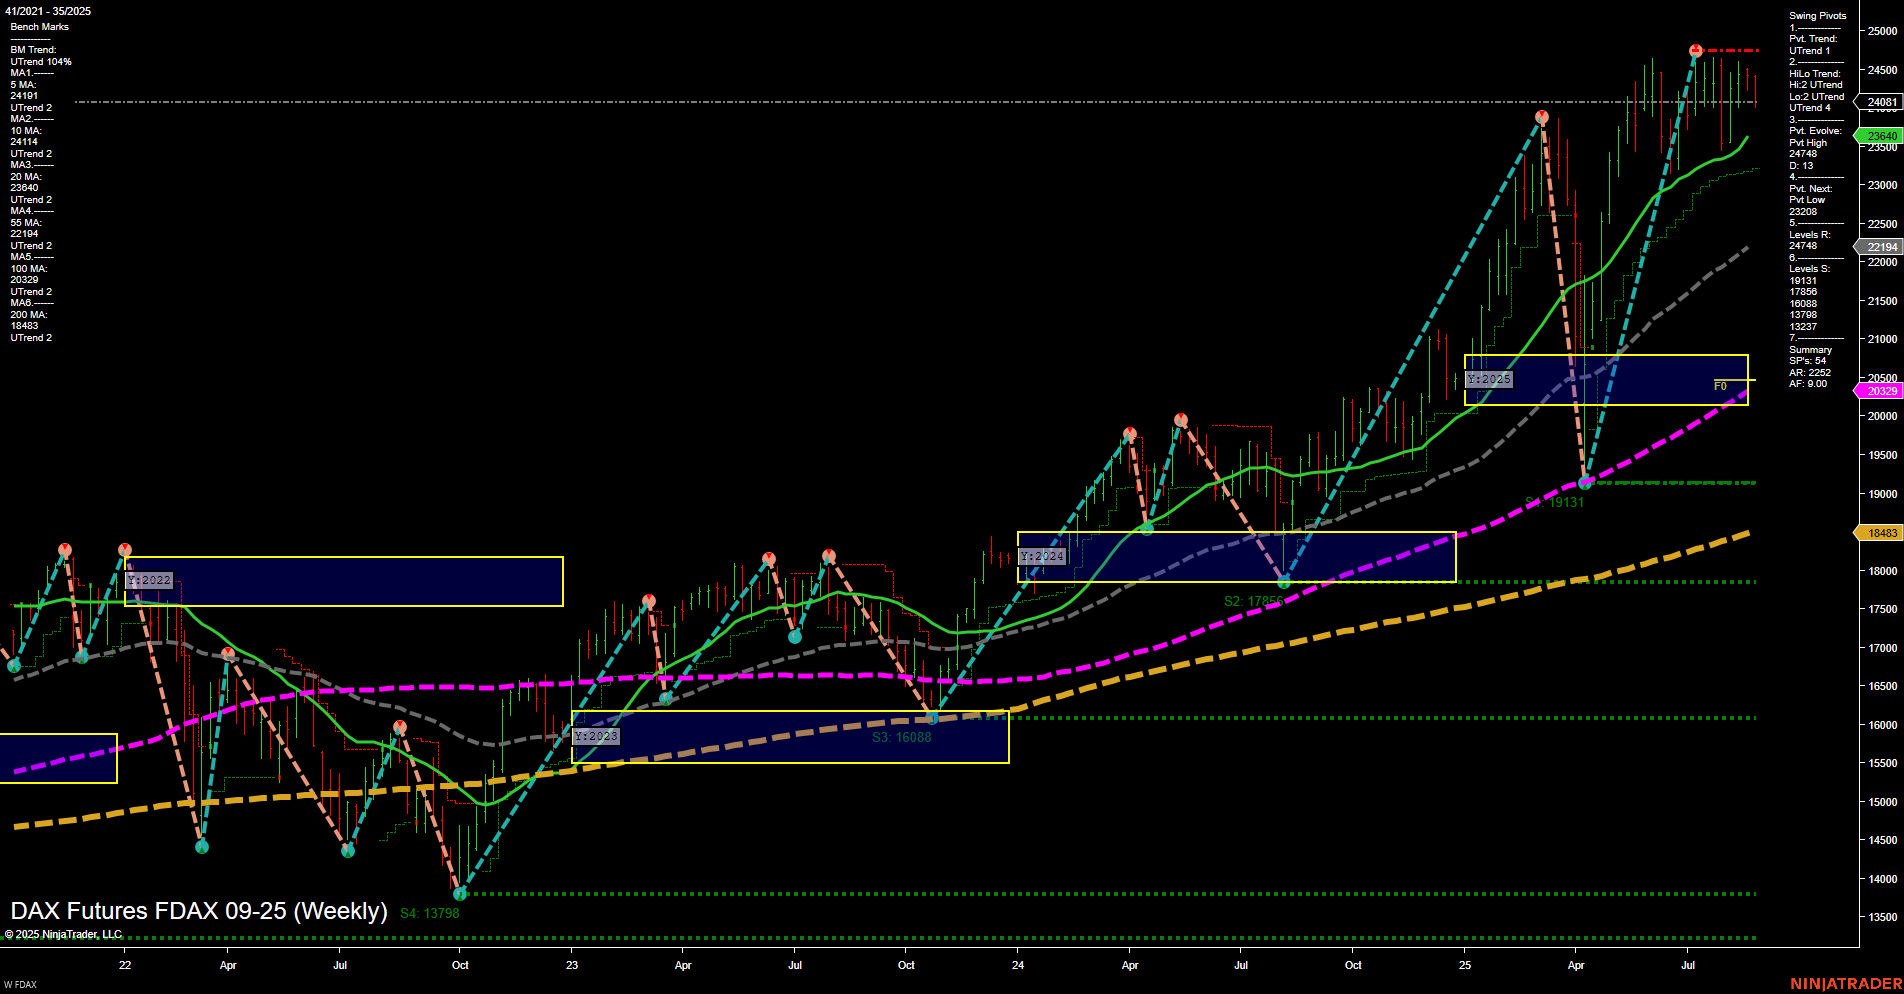
FDAX DAX Futures Weekly Chart Analysis: 2025-Aug-28 07:09 CT
Price Action
- Last: 24,301,
- Bars: Medium,
- Mom: Momentum slow.
WSFG Weekly
- Short-Term
- WSFG Current: -47%
- F0%/NTZ' Bias: Price Below,
- WSFG Trend: Down.
MSFG Month Aug
- Intermediate-Term
- MSFG Current: 6%
- F0%/NTZ' Bias: Price Above,
- MSFG Trend: Up.
YSFG Year 2025
- Long-Term
- YSFG Current: 110%
- F0%/NTZ' Bias: Price Above,
- YSFG Trend: Up.
Swing Pivots
- (Short-Term) 1. Pvt. Trend: UTrend,
- (Intermediate-Term) 2. HiLo Trend: UTrend,
- 3. Pvt. Evolve: Pvt High 24,749,
- 4. Pvt. Next: Pvt Low 22,218,
- 5. Levels R: 24,749, 24,681, 24,301,
- 6. Levels S: 22,918, 21,191, 19,131, 17,858, 16,088, 13,798.
Weekly Benchmarks
- (Intermediate-Term) 5 Week: 24,101 Up Trend,
- (Intermediate-Term) 10 Week: 24,114 Up Trend,
- (Long-Term) 20 Week: 23,640 Up Trend,
- (Long-Term) 55 Week: 22,714 Up Trend,
- (Long-Term) 100 Week: 20,328 Up Trend,
- (Long-Term) 200 Week: 18,483 Up Trend.
Recent Trade Signals
- 26 Aug 2025: Short FDAX 09-25 @ 24,253 Signals.USAR-WSFG
Overall Rating
- Short-Term: Neutral,
- Intermediate-Term: Bullish,
- Long-Term: Bullish.
Key Insights Summary
The FDAX weekly chart shows a market that remains in a strong long-term uptrend, supported by all major moving averages trending higher and price action well above yearly and monthly session fib grid centers. Intermediate-term momentum is also bullish, with the monthly fib grid and swing pivot trends both pointing up. However, short-term signals are mixed: the weekly session fib grid trend is down, and price is currently below the weekly NTZ center, indicating a possible short-term pullback or consolidation phase. The most recent trade signal was a short, reflecting this short-term weakness. Key resistance is clustered near recent highs (24,749, 24,681, 24,301), while support levels are well-defined below, with the next major swing low at 22,218. Overall, the market is in a corrective or consolidative phase within a broader bullish structure, with the potential for further pullbacks before the uptrend resumes. Volatility appears moderate, and the market is digesting gains after a strong rally, with higher lows and higher highs still intact on the larger timeframes.
Chart Analysis ATS AI Generated: 2025-08-28 07:09 for Informational use only, not trading advice. Terms and Risk Disclosure Copyright © 2025. Algo Trading Systems LLC.
