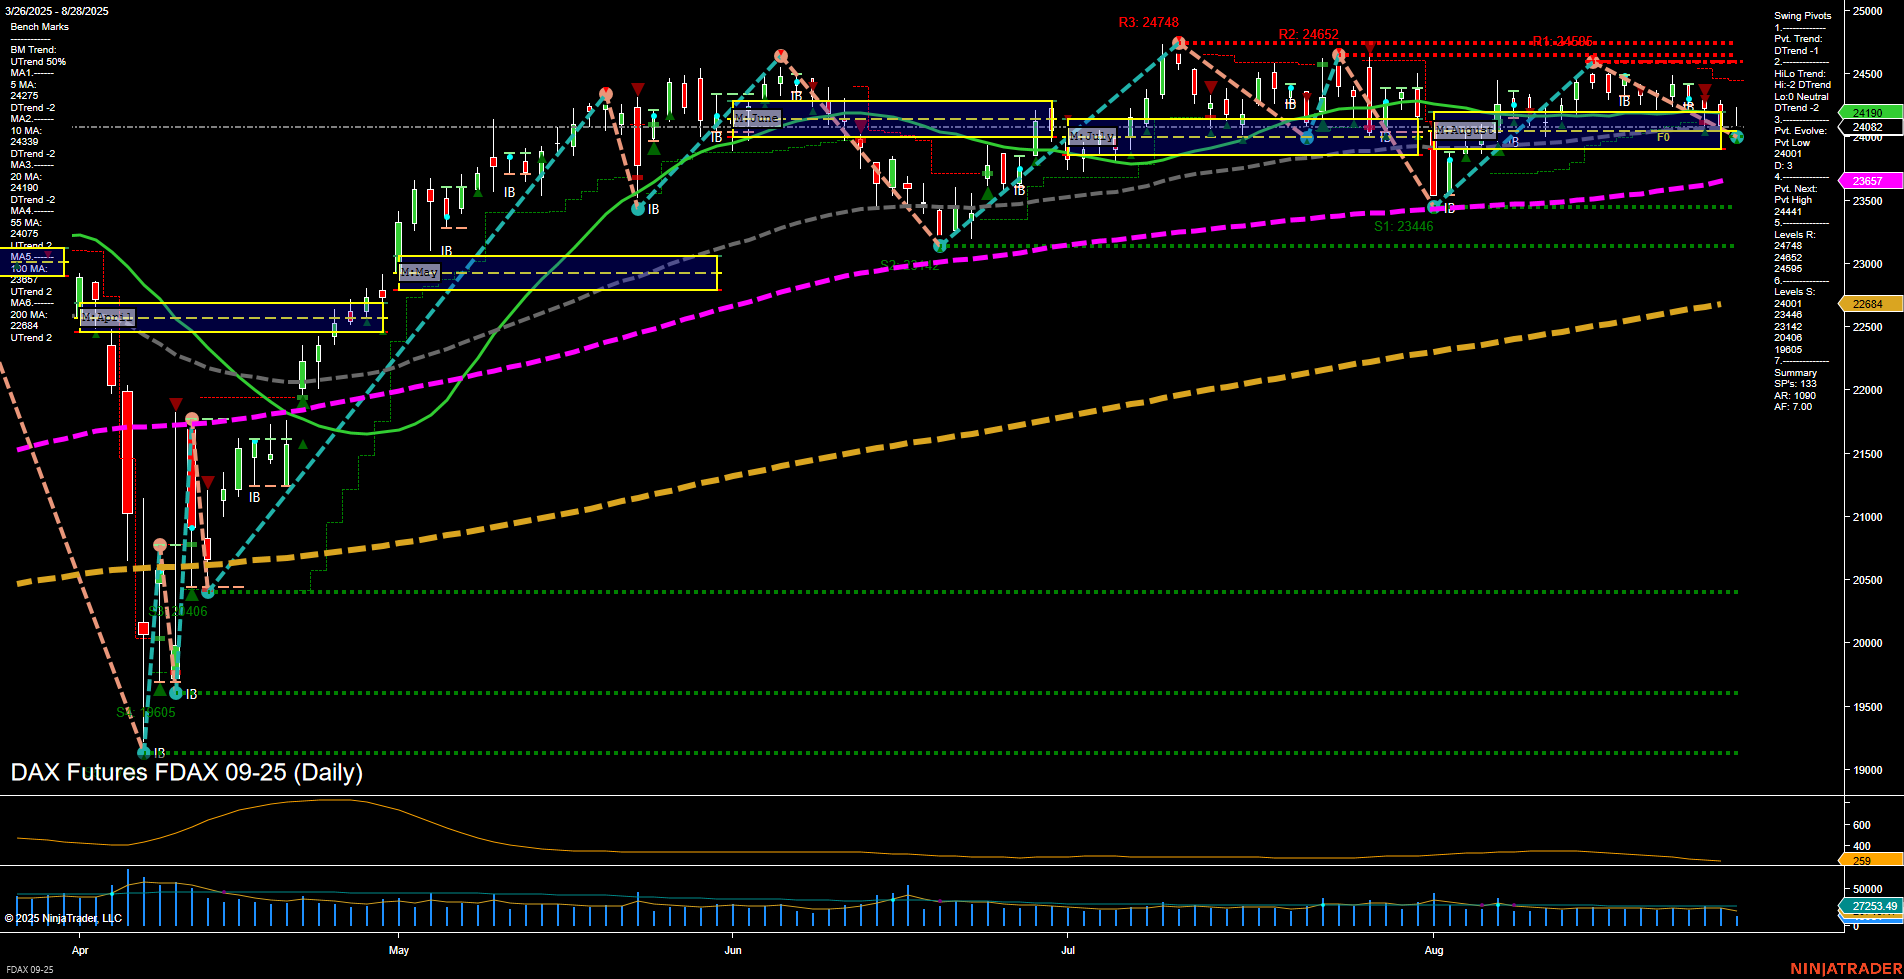
FDAX DAX Futures Daily Chart Analysis: 2025-Aug-28 07:08 CT
Price Action
- Last: 24190,
- Bars: Medium,
- Mom: Momentum slow.
WSFG Weekly
- Short-Term
- WSFG Current: -47%
- F0%/NTZ' Bias: Price Below,
- WSFG Trend: Down.
MSFG Month Aug
- Intermediate-Term
- MSFG Current: 6%
- F0%/NTZ' Bias: Price Above,
- MSFG Trend: Up.
YSFG Year 2025
- Long-Term
- YSFG Current: 110%
- F0%/NTZ' Bias: Price Above,
- YSFG Trend: Up.
Swing Pivots
- (Short-Term) 1. Pvt. Trend: DTrend,
- (Intermediate-Term) 2. HiLo Trend: DTrend,
- 3. Pvt. Evolve: Pvt Low 24001,
- 4. Pvt. Next: Pvt High 24402,
- 5. Levels R: 24411, 24402, 24346, 24262, 24148,
- 6. Levels S: 23446, 23018, 22406, 21065, 19605.
Daily Benchmarks
- (Short-Term) 5 Day: 24177 Down Trend,
- (Short-Term) 10 Day: 24339 Down Trend,
- (Intermediate-Term) 20 Day: 24190 Down Trend,
- (Intermediate-Term) 55 Day: 24075 Up Trend,
- (Long-Term) 100 Day: 23657 Up Trend,
- (Long-Term) 200 Day: 22684 Up Trend.
Additional Metrics
Recent Trade Signals
- 26 Aug 2025: Short FDAX 09-25 @ 24253 Signals.USAR-WSFG
Overall Rating
- Short-Term: Bearish,
- Intermediate-Term: Neutral,
- Long-Term: Bullish.
Key Insights Summary
The FDAX daily chart shows a market in transition. Short-term momentum has slowed, with price action currently below the weekly session fib grid (WSFG) NTZ, and both the 5-day and 10-day moving averages trending down. The short-term swing pivot trend is down, with the most recent pivot low at 24001 and resistance levels clustered above current price, indicating overhead supply. Intermediate-term signals are mixed: while the monthly session fib grid (MSFG) trend remains up and price is above the monthly NTZ, the intermediate swing pivot trend is down, and the 20-day moving average is also in a downtrend. However, the 55-day, 100-day, and 200-day moving averages are all in uptrends, supporting a bullish long-term outlook. Volatility (ATR) is moderate, and volume remains steady. The recent short signal (26 Aug) aligns with the short-term bearish bias, but the broader context suggests the market is consolidating within a larger uptrend, with potential for further pullbacks before any sustained move higher. Watch for reactions at key support (24001, 23446) and resistance (24402, 24411) levels to gauge the next directional move.
Chart Analysis ATS AI Generated: 2025-08-28 07:09 for Informational use only, not trading advice. Terms and Risk Disclosure Copyright © 2025. Algo Trading Systems LLC.
