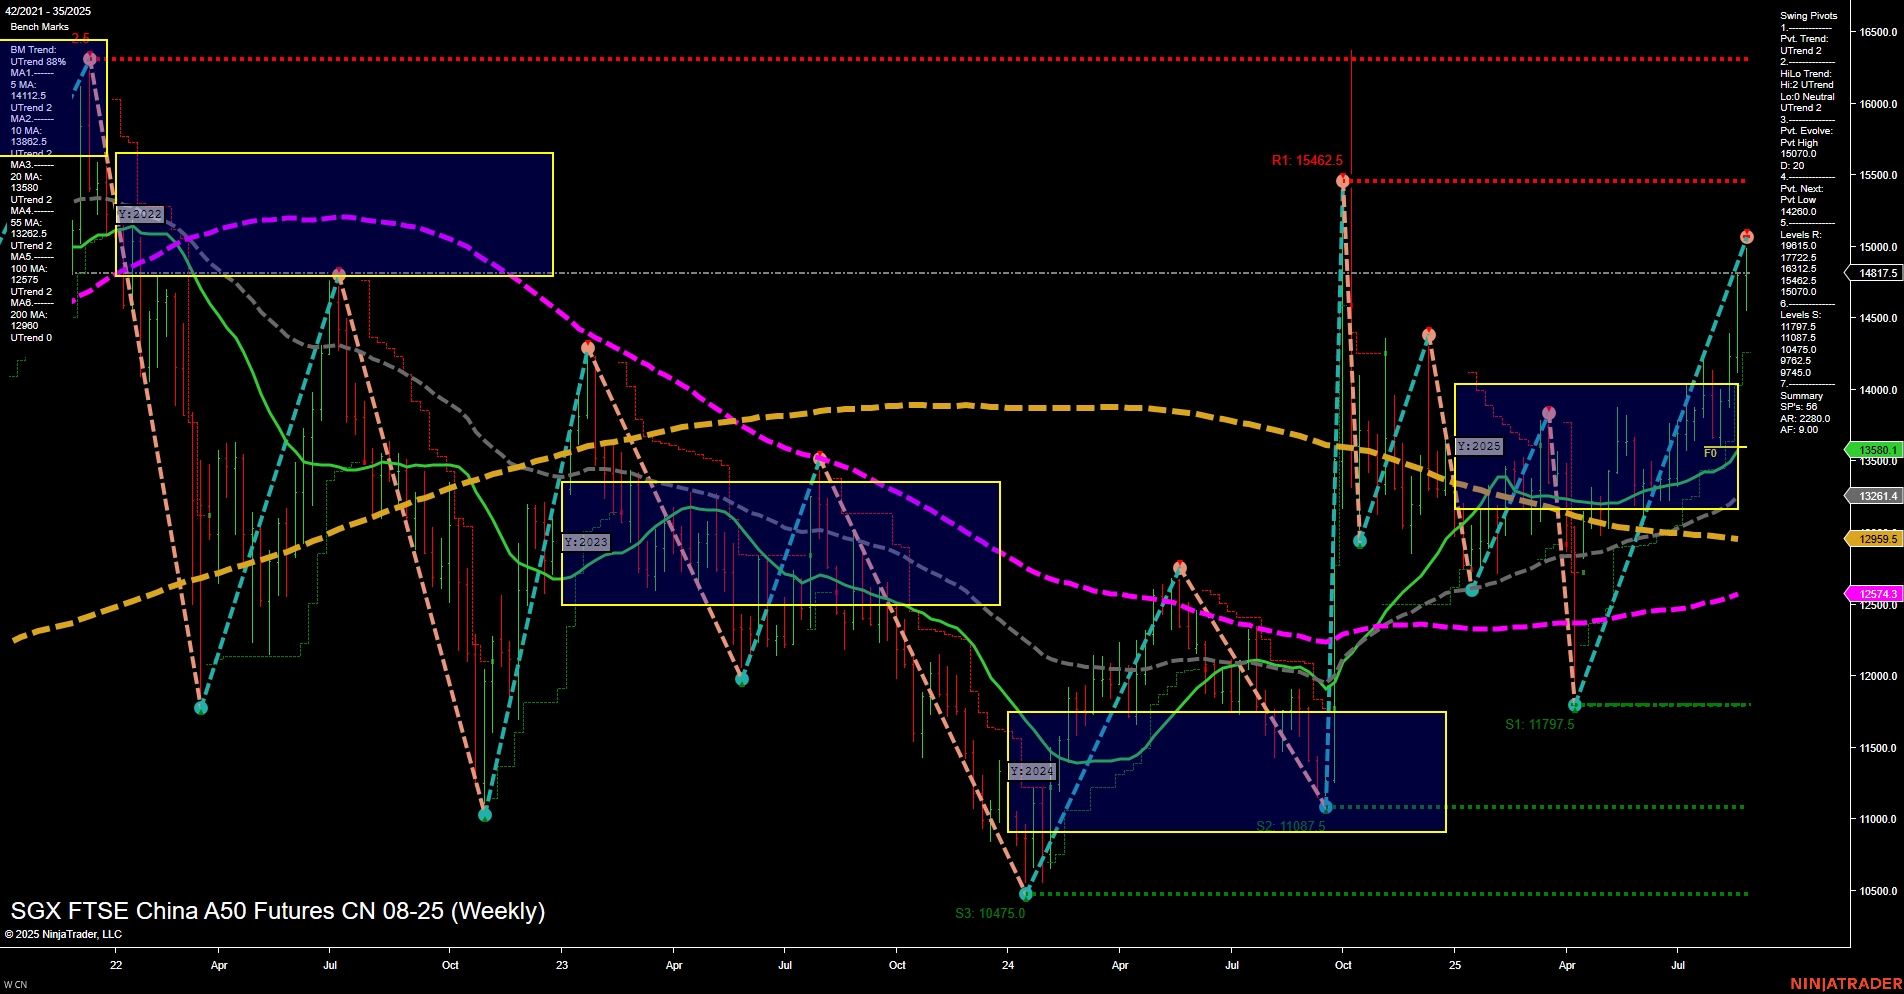
CN SGX FTSE China A50 Futures Weekly Chart Analysis: 2025-Aug-28 07:05 CT
Price Action
- Last: 14817.5,
- Bars: Large,
- Mom: Momentum fast.
WSFG Weekly
- Short-Term
- WSFG Current: NA%
- F0%/NTZ' Bias: Price Neutral,
- WSFG Trend: Neutral.
MSFG Month Aug
- Intermediate-Term
- MSFG Current: NA%
- F0%/NTZ' Bias: Price Neutral,
- MSFG Trend: Neutral.
YSFG Year 2025
- Long-Term
- YSFG Current: NA%
- F0%/NTZ' Bias: Price Neutral,
- YSFG Trend: Neutral.
Swing Pivots
- (Short-Term) 1. Pvt. Trend: UTrend,
- (Intermediate-Term) 2. HiLo Trend: UTrend,
- 3. Pvt. Evolve: Pvt High 15070.0,
- 4. Pvt. Next: Pvt Low 14260.0,
- 5. Levels R: 15462.5, 15070.0, 14817.5,
- 6. Levels S: 14260.0, 13261.0, 12995.0, 12574.3, 11797.5, 11097.5, 10475.0.
Weekly Benchmarks
- (Intermediate-Term) 5 Week: 13882.5 Up Trend,
- (Intermediate-Term) 10 Week: 14112.5 Up Trend,
- (Long-Term) 20 Week: 13580.1 Up Trend,
- (Long-Term) 55 Week: 13261.1 Up Trend,
- (Long-Term) 100 Week: 12995.9 Down Trend,
- (Long-Term) 200 Week: 12574.3 Down Trend.
Overall Rating
- Short-Term: Bullish,
- Intermediate-Term: Bullish,
- Long-Term: Neutral.
Key Insights Summary
The CN SGX FTSE China A50 Futures weekly chart shows a strong bullish recovery from the 2024 lows, with price action characterized by large, fast-moving bars and a clear upward momentum. Both short-term and intermediate-term swing pivot trends are up, supported by a series of higher highs and higher lows. The price is currently testing a key resistance cluster near 14817.5–15070.0, with the next major resistance at 15462.5. Multiple weekly moving averages (5, 10, 20, 55) are trending upward, confirming the bullish structure, while the longer-term 100 and 200 week MAs remain in a downtrend, indicating that the broader trend is still in transition. The market is consolidating above the NTZ (neutral zone) and F0% levels, suggesting a neutral-to-bullish bias as it attempts to break out of the recent range. Support levels are well-defined below, with 14260.0 as the nearest swing low. Overall, the chart reflects a market in bullish swing mode in the short and intermediate term, with long-term sentiment still neutral as it works through overhead resistance and legacy downtrends.
Chart Analysis ATS AI Generated: 2025-08-28 07:06 for Informational use only, not trading advice. Terms and Risk Disclosure Copyright © 2025. Algo Trading Systems LLC.
