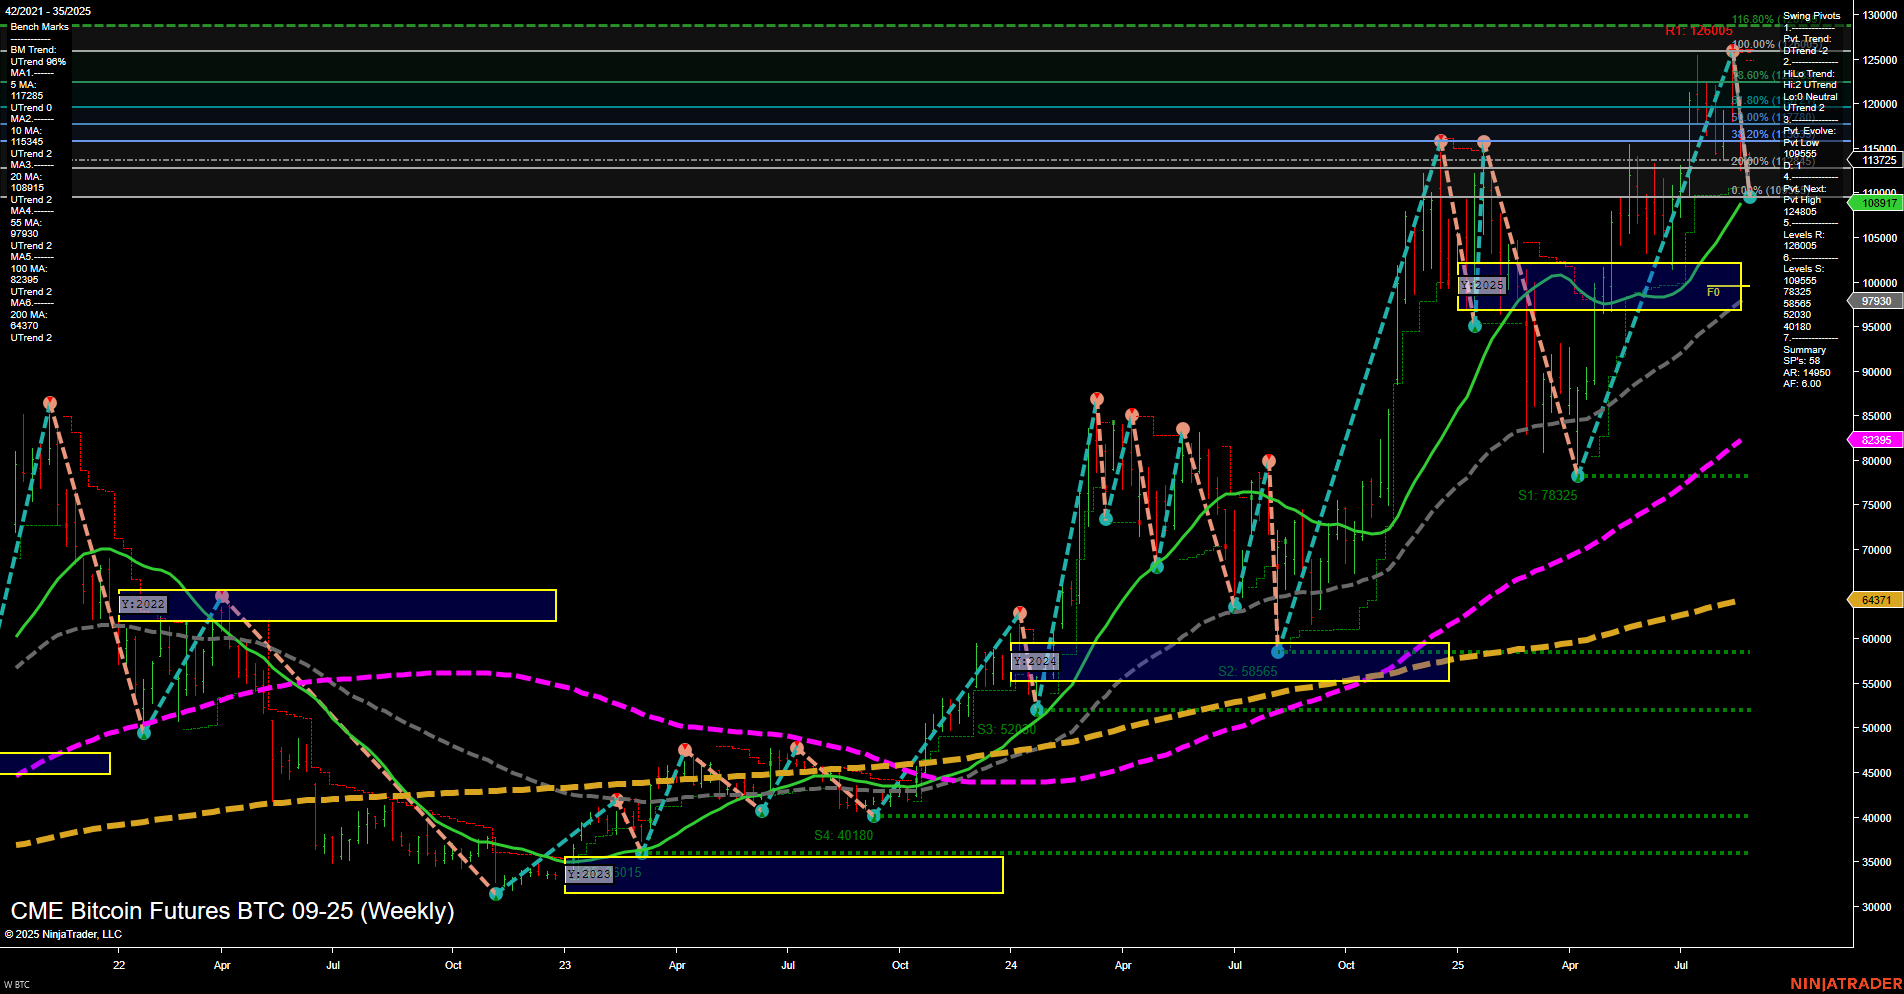
BTC CME Bitcoin Futures Weekly Chart Analysis: 2025-Aug-28 07:04 CT
Price Action
- Last: 117245,
- Bars: Large,
- Mom: Fast.
WSFG Weekly
- Short-Term
- WSFG Current: -10%
- F0%/NTZ' Bias: Price Below,
- WSFG Trend: Down.
MSFG Month Aug
- Intermediate-Term
- MSFG Current: -24%
- F0%/NTZ' Bias: Price Below,
- MSFG Trend: Down.
YSFG Year 2025
- Long-Term
- YSFG Current: 53%
- F0%/NTZ' Bias: Price Above,
- YSFG Trend: Up.
Swing Pivots
- (Short-Term) 1. Pvt. Trend: DTrend,
- (Intermediate-Term) 2. HiLo Trend: UTrend,
- 3. Pvt. Evolve: Pvt high 126000,
- 4. Pvt. Next: Pvt low 109515,
- 5. Levels R: 126000, 124805, 120000, 117245,
- 6. Levels S: 109515, 97930, 78325, 58665, 52000, 40180, 30150.
Weekly Benchmarks
- (Intermediate-Term) 5 Week: 117265 Up Trend,
- (Intermediate-Term) 10 Week: 113946 Up Trend,
- (Long-Term) 20 Week: 108195 Up Trend,
- (Long-Term) 55 Week: 82395 Up Trend,
- (Long-Term) 100 Week: 82965 Up Trend,
- (Long-Term) 200 Week: 64371 Up Trend.
Recent Trade Signals
- 22 Aug 2025: Long BTC 08-25 @ 117245 Signals.USAR.TR120
Overall Rating
- Short-Term: Bearish,
- Intermediate-Term: Neutral,
- Long-Term: Bullish.
Key Insights Summary
BTC CME Bitcoin Futures are currently trading near recent highs, with the last price at 117245 and strong upward momentum reflected in large weekly bars. Despite this, the short-term WSFG and MSFG trends have turned down, with price below their respective NTZ/F0% levels, indicating a short-term pullback or correction phase. The swing pivot summary shows a developing downtrend in the short-term (DTrend), but the intermediate-term HiLo trend remains up, suggesting the broader uptrend is intact. Key resistance is clustered near the recent high at 126000, while support levels are well-defined below, with the next major swing support at 109515. All benchmark moving averages from 5 to 200 weeks are trending up, confirming strong long-term bullish structure. The most recent trade signal was a long entry, aligning with the prevailing long-term uptrend. Overall, the market is experiencing a short-term retracement within a larger bullish cycle, with volatility elevated and price action testing upper resistance zones. The structure suggests a consolidation or corrective phase before potential trend continuation, with the long-term outlook remaining positive as long as key support levels hold.
Chart Analysis ATS AI Generated: 2025-08-28 07:04 for Informational use only, not trading advice. Terms and Risk Disclosure Copyright © 2025. Algo Trading Systems LLC.
