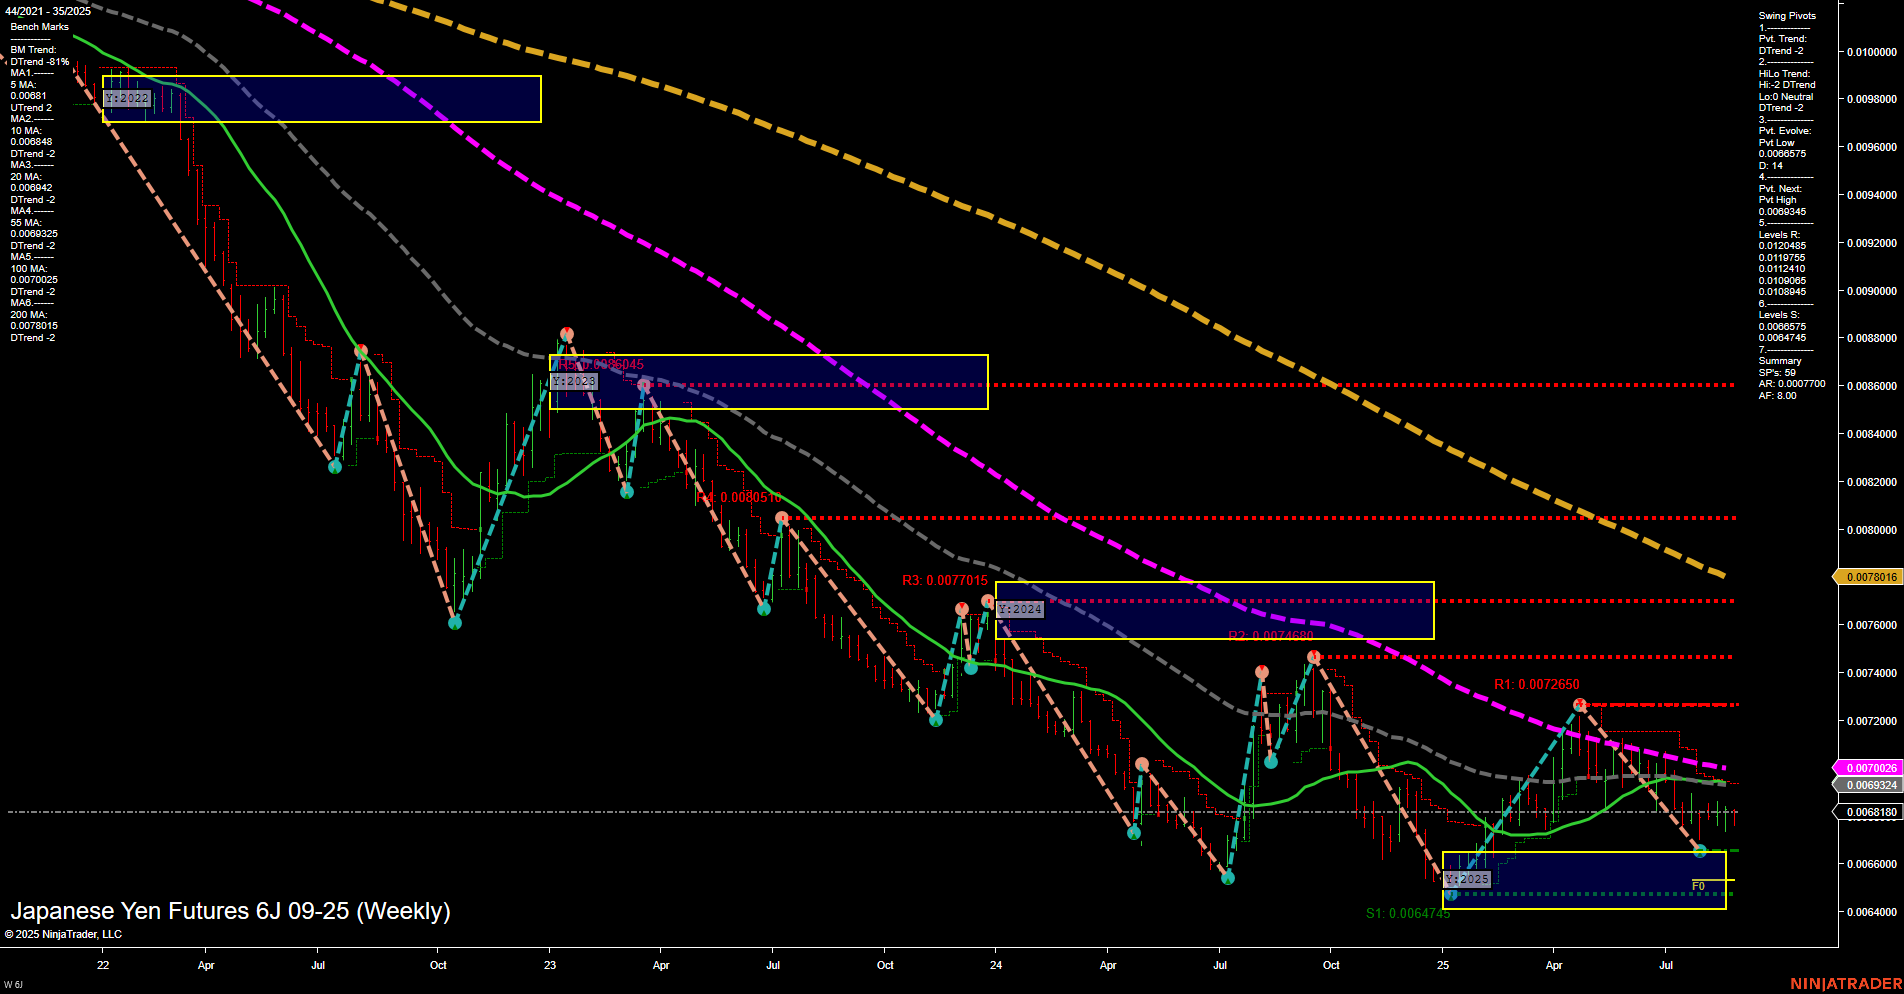
6J Japanese Yen Futures Weekly Chart Analysis: 2025-Aug-28 07:03 CT
Price Action
- Last: 0.0068016,
- Bars: Medium,
- Mom: Momentum slow.
WSFG Weekly
- Short-Term
- WSFG Current: -6%
- F0%/NTZ' Bias: Price Below,
- WSFG Trend: Down.
MSFG Month Aug
- Intermediate-Term
- MSFG Current: 54%
- F0%/NTZ' Bias: Price Above,
- MSFG Trend: Up.
YSFG Year 2025
- Long-Term
- YSFG Current: 24%
- F0%/NTZ' Bias: Price Above,
- YSFG Trend: Up.
Swing Pivots
- (Short-Term) 1. Pvt. Trend: DTrend,
- (Intermediate-Term) 2. HiLo Trend: Lo2 Neutral,
- 3. Pvt. Evolve: Pvt low 0.0064745,
- 4. Pvt. Next: Pvt high 0.0072045,
- 5. Levels R: 0.0083045, 0.0080510, 0.0077015, 0.0074260, 0.0072650,
- 6. Levels S: 0.0064745, 0.0063245, 0.0061255, 0.0059915, 0.0058700.
Weekly Benchmarks
- (Intermediate-Term) 5 Week: 0.0069241 Down Trend,
- (Intermediate-Term) 10 Week: 0.0070206 Down Trend,
- (Long-Term) 20 Week: 0.0070816 Down Trend,
- (Long-Term) 55 Week: 0.0077026 Down Trend,
- (Long-Term) 100 Week: 0.0080041 Down Trend,
- (Long-Term) 200 Week: 0.0087815 Down Trend.
Recent Trade Signals
- 28 Aug 2025: Long 6J 09-25 @ 0.006808 Signals.USAR.TR120
- 26 Aug 2025: Short 6J 09-25 @ 0.0068035 Signals.USAR-WSFG
Overall Rating
- Short-Term: Bearish,
- Intermediate-Term: Neutral,
- Long-Term: Bearish.
Key Insights Summary
The Japanese Yen futures (6J) weekly chart shows a market in a prolonged downtrend, with all major long-term and intermediate-term moving averages trending lower and price action consistently below these benchmarks. The short-term WSFG trend remains down, with price below the NTZ center, and the most recent swing pivot trend is also down. However, the intermediate-term MSFG trend is up, suggesting some recent upward retracement or bounce, but this is not yet strong enough to shift the overall structure. The yearly session grid and swing pivots highlight significant resistance overhead, with multiple failed attempts to break higher, and support is clustered near recent lows. Recent trade signals indicate mixed short-term activity, but the dominant technical structure remains bearish, with rallies being sold and lower highs forming. The market is in a corrective phase within a broader downtrend, with volatility compressing and momentum slowing, suggesting a potential for further consolidation or a retest of support before any sustained reversal can develop.
Chart Analysis ATS AI Generated: 2025-08-28 07:03 for Informational use only, not trading advice. Terms and Risk Disclosure Copyright © 2025. Algo Trading Systems LLC.
