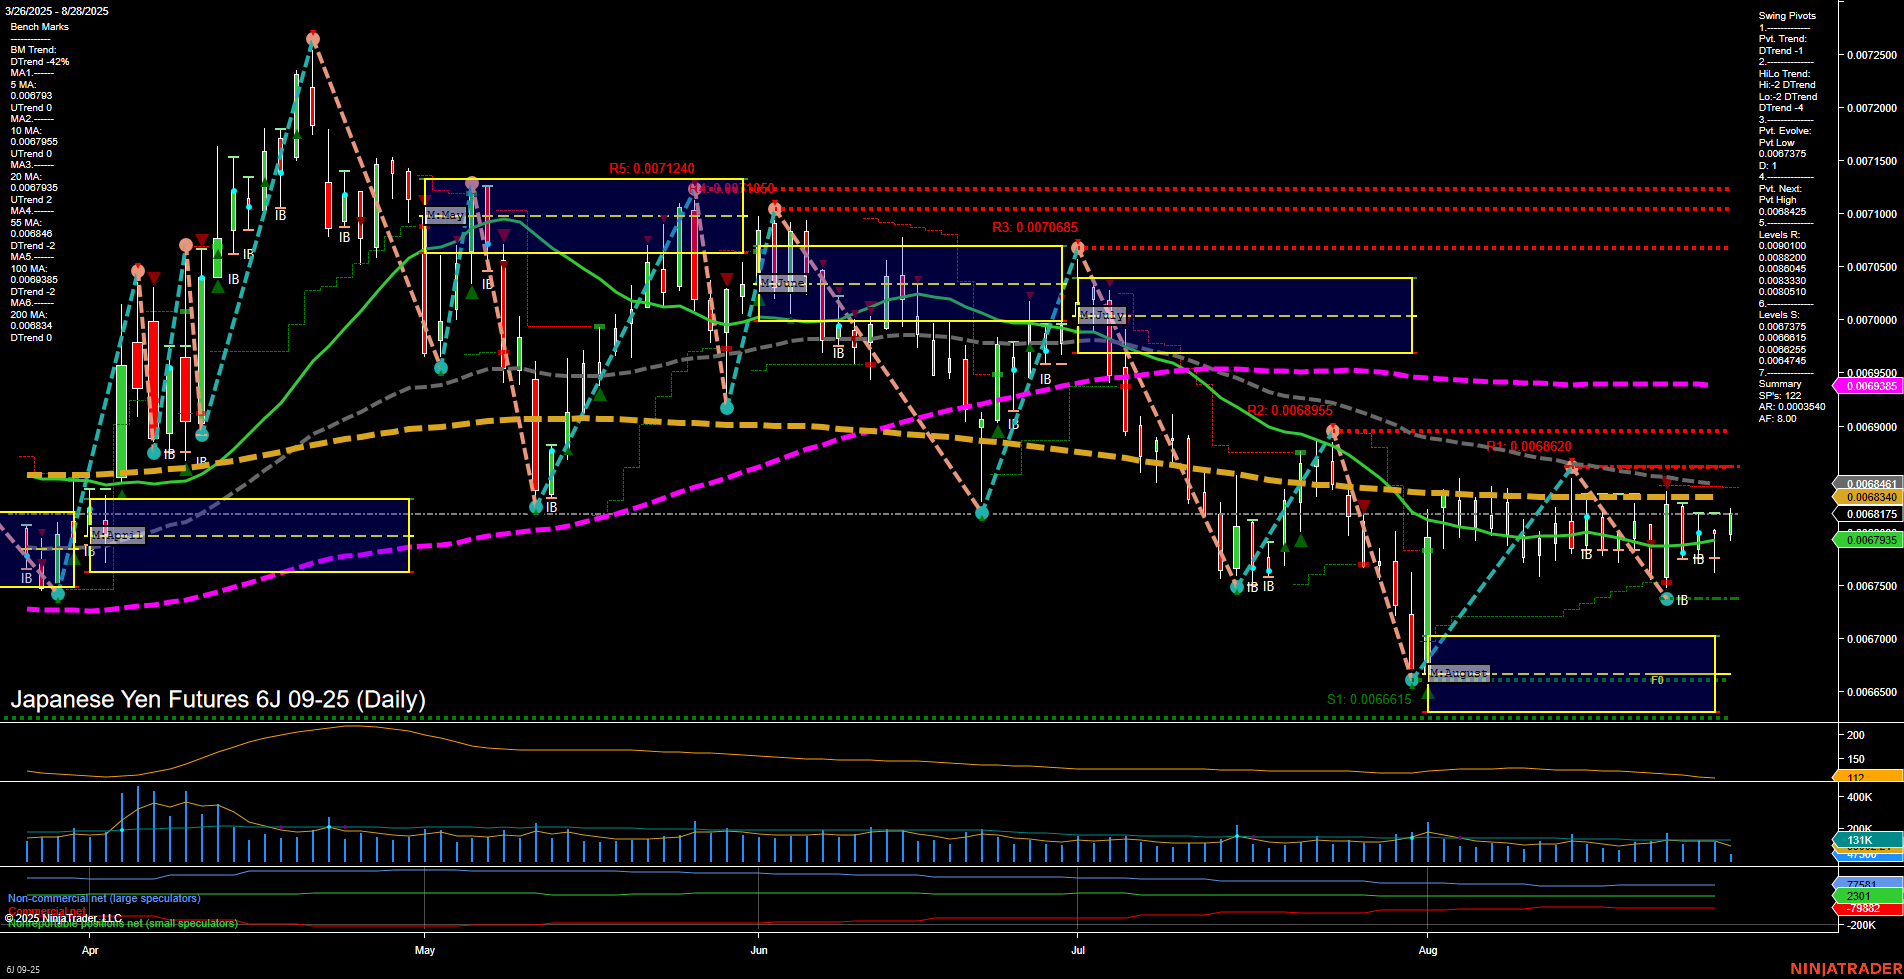
6J Japanese Yen Futures Daily Chart Analysis: 2025-Aug-28 07:03 CT
Price Action
- Last: 0.0067935,
- Bars: Small,
- Mom: Momentum slow.
WSFG Weekly
- Short-Term
- WSFG Current: -6%
- F0%/NTZ' Bias: Price Below,
- WSFG Trend: Down.
MSFG Month Aug
- Intermediate-Term
- MSFG Current: 54%
- F0%/NTZ' Bias: Price Above,
- MSFG Trend: Up.
YSFG Year 2025
- Long-Term
- YSFG Current: 24%
- F0%/NTZ' Bias: Price Above,
- YSFG Trend: Up.
Swing Pivots
- (Short-Term) 1. Pvt. Trend: DTrend,
- (Intermediate-Term) 2. HiLo Trend: DTrend,
- 3. Pvt. Evolve: Pvt low 0.0067375,
- 4. Pvt. Next: Pvt high 0.0068425,
- 5. Levels R: 0.0071240, 0.0071050, 0.0070685, 0.0068955, 0.0068620, 0.0068425,
- 6. Levels S: 0.0067375, 0.0066615, 0.0065915, 0.0065745.
Daily Benchmarks
- (Short-Term) 5 Day: 0.0067933 Down Trend,
- (Short-Term) 10 Day: 0.0068175 Down Trend,
- (Intermediate-Term) 20 Day: 0.0068451 Down Trend,
- (Intermediate-Term) 55 Day: 0.0068843 Down Trend,
- (Long-Term) 100 Day: 0.0069635 Down Trend,
- (Long-Term) 200 Day: 0.0070735 Down Trend.
Additional Metrics
Recent Trade Signals
- 28 Aug 2025: Long 6J 09-25 @ 0.006808 Signals.USAR.TR120
- 26 Aug 2025: Short 6J 09-25 @ 0.0068035 Signals.USAR-WSFG
Overall Rating
- Short-Term: Neutral,
- Intermediate-Term: Bearish,
- Long-Term: Bearish.
Key Insights Summary
The 6J Japanese Yen Futures daily chart shows a market in a corrective phase after a prolonged downtrend. Price action is consolidating with small bars and slow momentum, indicating indecision and a lack of strong directional conviction. The short-term WSFG trend remains down, with price below the weekly NTZ, while the intermediate and long-term MSFG and YSFG trends are up, but price is still below all major moving averages, which are aligned in a downtrend. Swing pivots confirm a short-term and intermediate-term downtrend, with the most recent pivot low at 0.0067375 and resistance levels stacked above. The recent trade signals reflect this choppy environment, with both long and short signals triggered in close succession. Volatility (ATR) and volume (VOLMA) are moderate, supporting the view of a market in consolidation rather than trending. Overall, the chart suggests a market in transition, with potential for further consolidation or a base-building phase before any sustained reversal. Swing traders may observe for a decisive break above resistance or a new swing low to confirm the next directional move.
Chart Analysis ATS AI Generated: 2025-08-28 07:03 for Informational use only, not trading advice. Terms and Risk Disclosure Copyright © 2025. Algo Trading Systems LLC.
