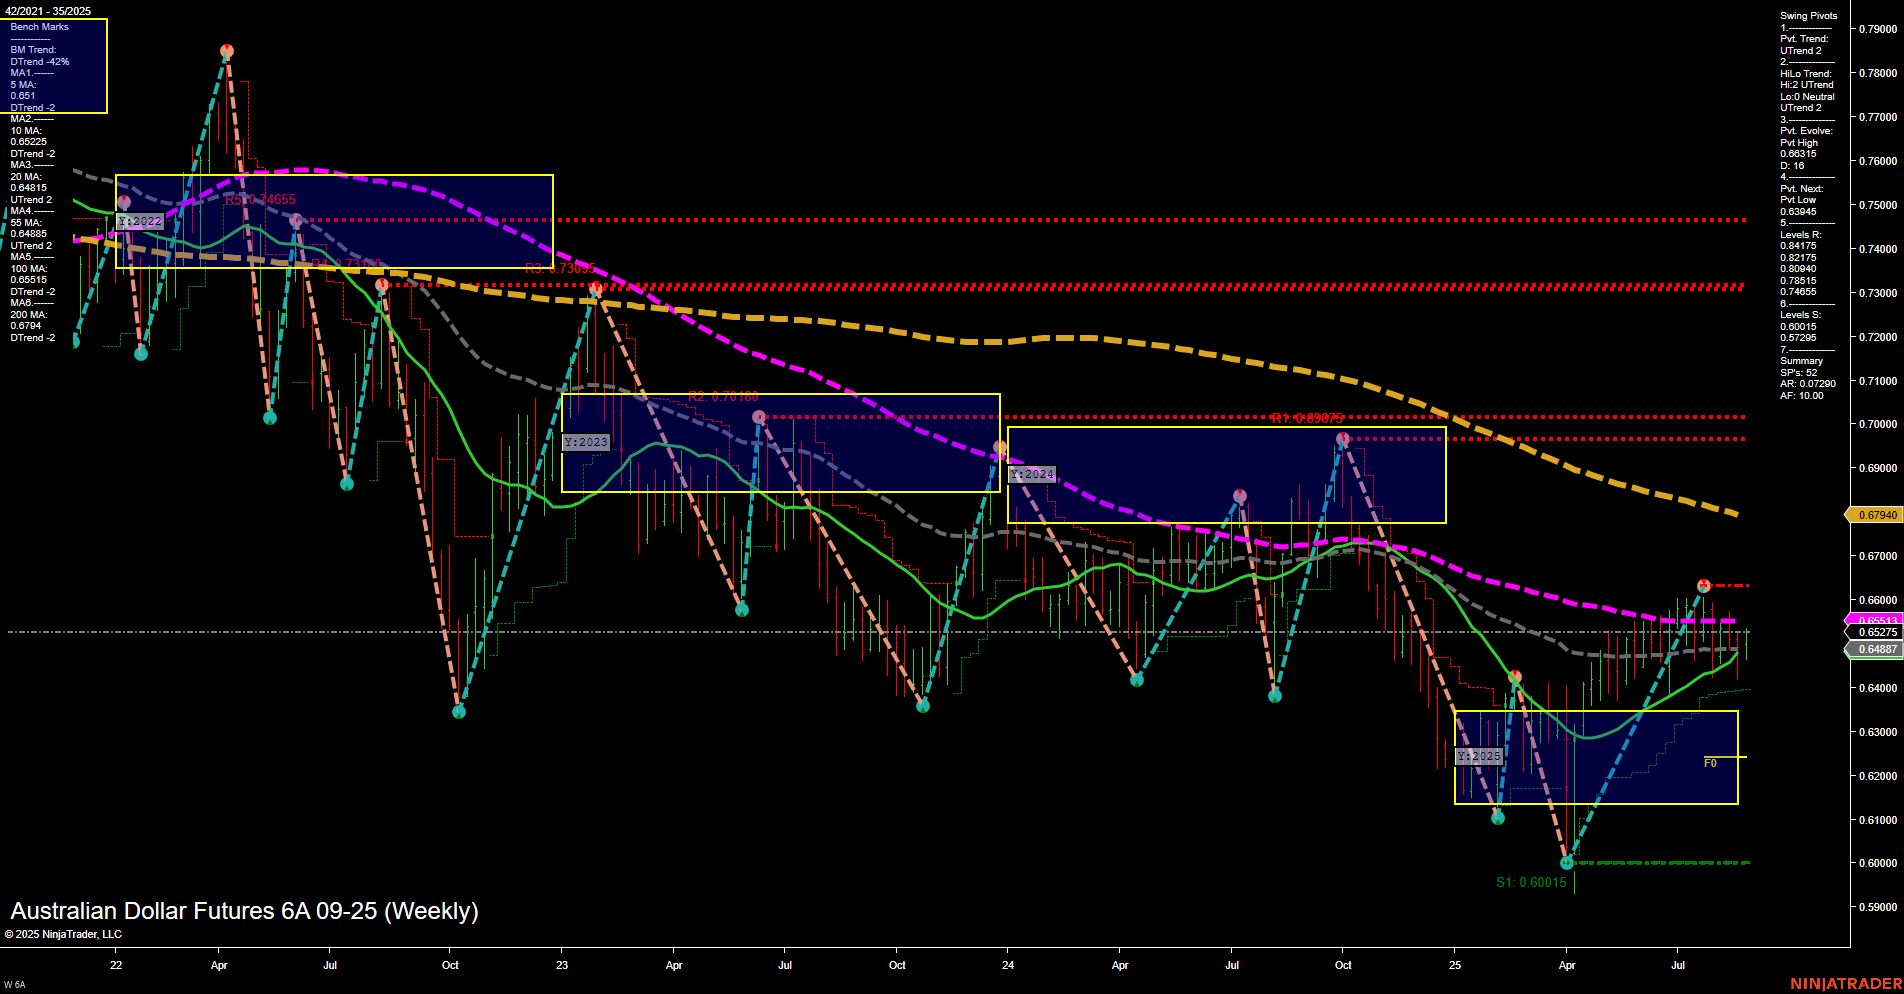
6A Australian Dollar Futures Weekly Chart Analysis: 2025-Aug-28 07:00 CT
Price Action
- Last: 0.65177,
- Bars: Medium,
- Mom: Momentum average.
WSFG Weekly
- Short-Term
- WSFG Current: NA%
- F0%/NTZ' Bias: Price Neutral,
- WSFG Trend: Neutral.
MSFG Month Aug
- Intermediate-Term
- MSFG Current: NA%
- F0%/NTZ' Bias: Price Neutral,
- MSFG Trend: Neutral.
YSFG Year 2025
- Long-Term
- YSFG Current: NA%
- F0%/NTZ' Bias: Price Neutral,
- YSFG Trend: Neutral.
Swing Pivots
- (Short-Term) 1. Pvt. Trend: UTrend,
- (Intermediate-Term) 2. HiLo Trend: UTrend,
- 3. Pvt. Evolve: Pvt low 0.60015,
- 4. Pvt. Next: Pvt high 0.66975,
- 5. Levels R: 0.66975, 0.68975, 0.70100,
- 6. Levels S: 0.64847, 0.60015.
Weekly Benchmarks
- (Intermediate-Term) 5 Week: 0.6485 Up Trend,
- (Intermediate-Term) 10 Week: 0.6455 Up Trend,
- (Long-Term) 20 Week: 0.6522 Up Trend,
- (Long-Term) 55 Week: 0.6614 Down Trend,
- (Long-Term) 100 Week: 0.6702 Down Trend,
- (Long-Term) 200 Week: 0.6794 Down Trend.
Recent Trade Signals
- 28 Aug 2025: Long 6A 09-25 @ 0.6514 Signals.USAR-WSFG
- 22 Aug 2025: Long 6A 09-25 @ 0.64975 Signals.USAR.TR120
- 22 Aug 2025: Short 6A 09-25 @ 0.64185 Signals.USAR-MSFG
Overall Rating
- Short-Term: Bullish,
- Intermediate-Term: Bullish,
- Long-Term: Bearish.
Key Insights Summary
The Australian Dollar Futures (6A) weekly chart shows a market in transition. Price action has shifted from a significant swing low at 0.60015, with a series of higher lows and a recent push above key short- and intermediate-term moving averages. Both the short-term and intermediate-term swing pivot trends are up, supported by recent long trade signals and upward momentum in the 5, 10, and 20-week moving averages. However, the long-term trend remains bearish, as the 55, 100, and 200-week moving averages are still trending down and positioned above current price, acting as resistance. The market is currently consolidating just below the 0.66975 resistance, with support at 0.64847 and 0.60015. The neutral bias across the session fib grids suggests a pause or potential inflection point, with the market awaiting a catalyst for a sustained breakout or reversal. Overall, the structure favors a bullish bias in the short- to intermediate-term, but the long-term downtrend and overhead resistance levels warrant close monitoring for signs of exhaustion or reversal.
Chart Analysis ATS AI Generated: 2025-08-28 07:01 for Informational use only, not trading advice. Terms and Risk Disclosure Copyright © 2025. Algo Trading Systems LLC.
