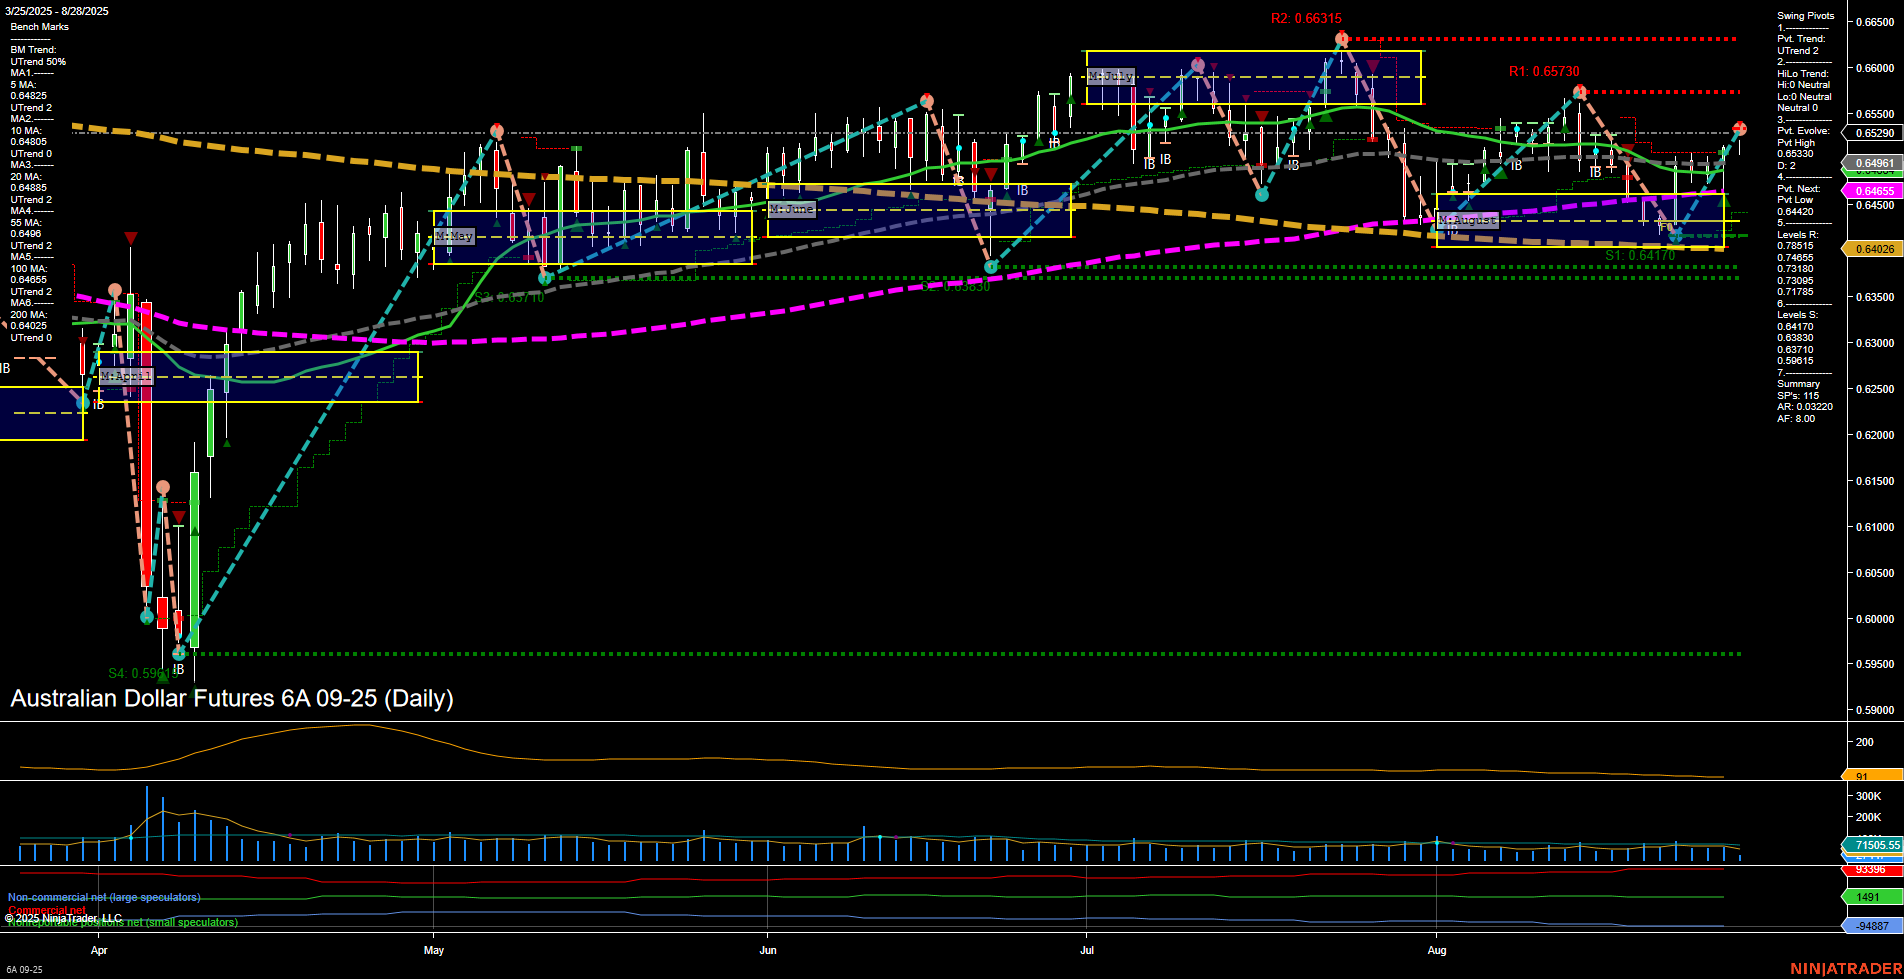
6A Australian Dollar Futures Daily Chart Analysis: 2025-Aug-28 07:00 CT
Price Action
- Last: 0.64951,
- Bars: Medium,
- Mom: Momentum average.
WSFG Weekly
- Short-Term
- WSFG Current: NA%
- F0%/NTZ' Bias: Price Neutral,
- WSFG Trend: Neutral.
MSFG Month Aug
- Intermediate-Term
- MSFG Current: NA%
- F0%/NTZ' Bias: Price Neutral,
- MSFG Trend: Neutral.
YSFG Year 2025
- Long-Term
- YSFG Current: NA%
- F0%/NTZ' Bias: Price Neutral,
- YSFG Trend: Neutral.
Swing Pivots
- (Short-Term) 1. Pvt. Trend: UTrend,
- (Intermediate-Term) 2. HiLo Trend: UTrend,
- 3. Pvt. Evolve: Pvt High 0.65320,
- 4. Pvt. Next: Pvt Low 0.64170,
- 5. Levels R: 0.66315, 0.65730, 0.65290,
- 6. Levels S: 0.64170, 0.64026.
Daily Benchmarks
- (Short-Term) 5 Day: 0.64825 Up Trend,
- (Short-Term) 10 Day: 0.64805 Up Trend,
- (Intermediate-Term) 20 Day: 0.64955 Up Trend,
- (Intermediate-Term) 55 Day: 0.64842 Down Trend,
- (Long-Term) 100 Day: 0.64655 Down Trend,
- (Long-Term) 200 Day: 0.64026 Down Trend.
Additional Metrics
Recent Trade Signals
- 28 Aug 2025: Long 6A 09-25 @ 0.6514 Signals.USAR-WSFG
- 22 Aug 2025: Long 6A 09-25 @ 0.64975 Signals.USAR.TR120
- 22 Aug 2025: Short 6A 09-25 @ 0.64185 Signals.USAR-MSFG
Overall Rating
- Short-Term: Bullish,
- Intermediate-Term: Bullish,
- Long-Term: Neutral.
Key Insights Summary
The 6A Australian Dollar Futures daily chart shows a recent shift to bullish momentum in the short and intermediate term, as indicated by the UTrend in both swing pivot and HiLo trends, and confirmation from the 5, 10, and 20-day moving averages all trending upward. Price is currently consolidating just below a recent swing high, with resistance levels at 0.65290, 0.65730, and 0.66315, and support at 0.64170 and 0.64026. The long-term trend remains neutral, with the 55, 100, and 200-day moving averages still in a downtrend, suggesting that the broader trend has not yet fully reversed. Volatility (ATR) and volume (VOLMA) are moderate, supporting the current price action. Recent trade signals have favored the long side, reflecting the short-term bullish bias. The market appears to be in a recovery phase, with potential for further upside if resistance levels are broken, but still within a larger consolidation range for the year.
Chart Analysis ATS AI Generated: 2025-08-28 07:00 for Informational use only, not trading advice. Terms and Risk Disclosure Copyright © 2025. Algo Trading Systems LLC.
