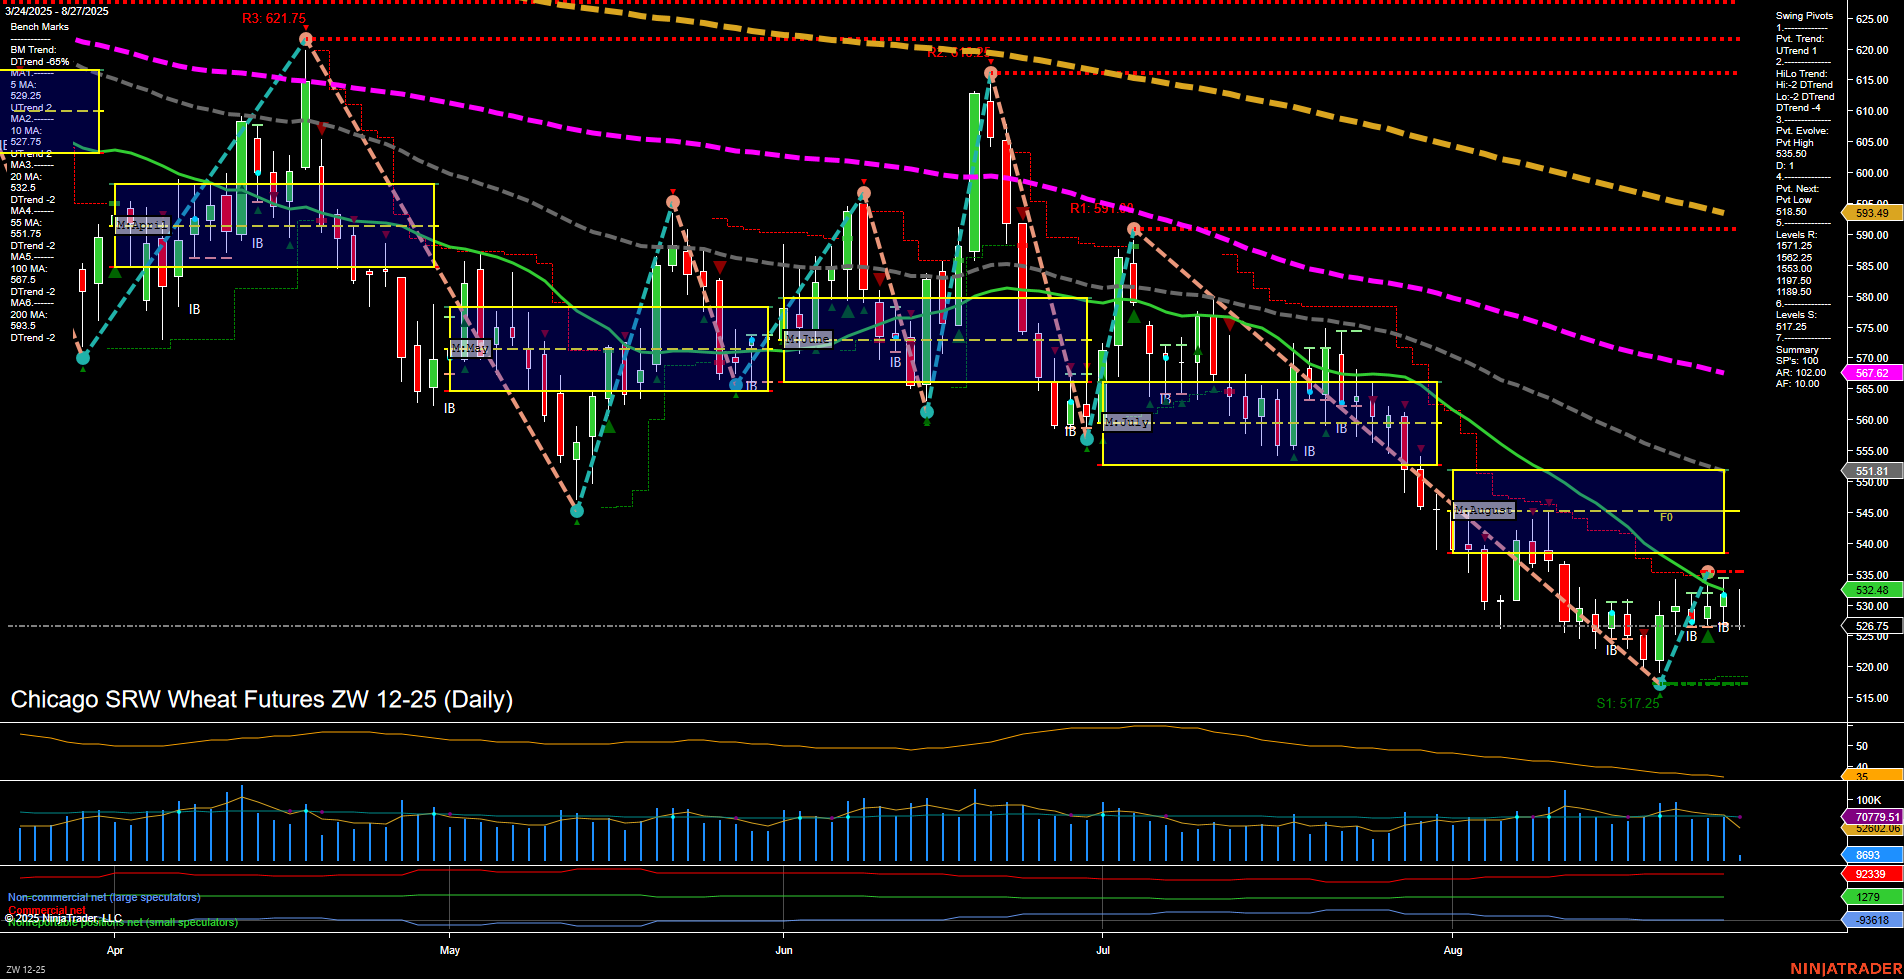
ZW Chicago SRW Wheat Futures Daily Chart Analysis: 2025-Aug-27 07:24 CT
Price Action
- Last: 532.48,
- Bars: Medium,
- Mom: Momentum slow.
WSFG Weekly
- Short-Term
- WSFG Current: -6%
- F0%/NTZ' Bias: Price Below,
- WSFG Trend: Down.
MSFG Month Aug
- Intermediate-Term
- MSFG Current: -46%
- F0%/NTZ' Bias: Price Below,
- MSFG Trend: Down.
YSFG Year 2025
- Long-Term
- YSFG Current: -36%
- F0%/NTZ' Bias: Price Below,
- YSFG Trend: Down.
Swing Pivots
- (Short-Term) 1. Pvt. Trend: UTrend,
- (Intermediate-Term) 2. HiLo Trend: DTrend,
- 3. Pvt. Evolve: Pvt low 517.25,
- 4. Pvt. Next: Pvt high 551.81,
- 5. Levels R: 551.81, 593.49,
- 6. Levels S: 517.25, 510.00.
Daily Benchmarks
- (Short-Term) 5 Day: 526.25 Down Trend,
- (Short-Term) 10 Day: 527.75 Down Trend,
- (Intermediate-Term) 20 Day: 532.48 Down Trend,
- (Intermediate-Term) 55 Day: 567.62 Down Trend,
- (Long-Term) 100 Day: 570.00 Down Trend,
- (Long-Term) 200 Day: 593.49 Down Trend.
Additional Metrics
Overall Rating
- Short-Term: Neutral,
- Intermediate-Term: Bearish,
- Long-Term: Bearish.
Key Insights Summary
The ZW Chicago SRW Wheat Futures daily chart shows a market that has been under sustained pressure across all timeframes, with price action currently below all major session fib grid levels and moving averages. The short-term swing pivot has shifted to an uptrend following a recent pivot low at 517.25, suggesting a possible attempt at a short-term bounce or retracement. However, the intermediate and long-term trends remain firmly down, as indicated by the MSFG and YSFG readings, as well as the persistent downtrend in all benchmark moving averages. Resistance is overhead at 551.81 and 593.49, while support is established at 517.25 and 510.00. Volatility remains moderate, and volume is steady but not signaling a major reversal. The overall structure suggests the market is in a corrective phase within a broader downtrend, with any rallies likely to encounter significant resistance unless there is a shift in momentum or a fundamental catalyst.
Chart Analysis ATS AI Generated: 2025-08-27 07:25 for Informational use only, not trading advice. Terms and Risk Disclosure Copyright © 2025. Algo Trading Systems LLC.
