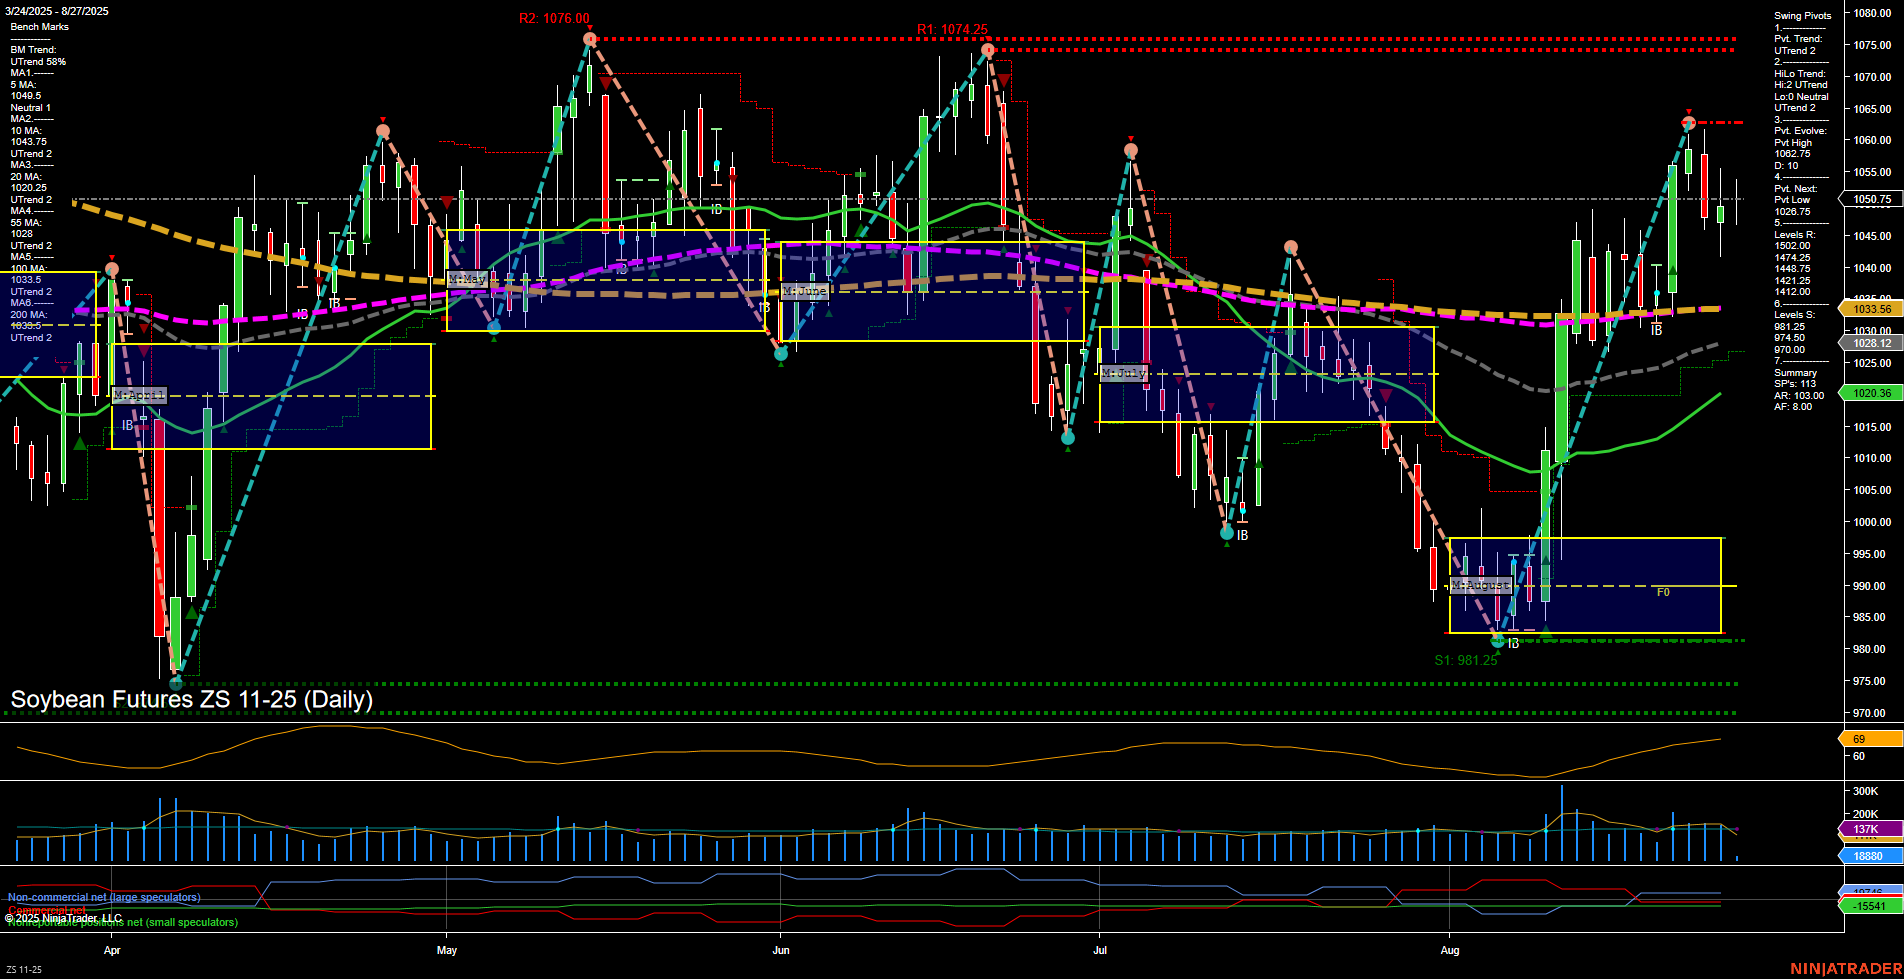
ZS Soybean Futures Daily Chart Analysis: 2025-Aug-27 07:24 CT
Price Action
- Last: 1053.00,
- Bars: Medium,
- Mom: Momentum fast.
WSFG Weekly
- Short-Term
- WSFG Current: -21%
- F0%/NTZ' Bias: Price Below,
- WSFG Trend: Down.
MSFG Month Aug
- Intermediate-Term
- MSFG Current: 117%
- F0%/NTZ' Bias: Price Above,
- MSFG Trend: Up.
YSFG Year 2025
- Long-Term
- YSFG Current: 11%
- F0%/NTZ' Bias: Price Above,
- YSFG Trend: Up.
Swing Pivots
- (Short-Term) 1. Pvt. Trend: UTrend,
- (Intermediate-Term) 2. HiLo Trend: UTrend,
- 3. Pvt. Evolve: Pvt High 1062.75,
- 4. Pvt. Next: Pvt Low 1025.00,
- 5. Levels R: 1076.00, 1074.25, 1062.75,
- 6. Levels S: 1025.00, 1020.36, 981.25.
Daily Benchmarks
- (Short-Term) 5 Day: 1056.00 Up Trend,
- (Short-Term) 10 Day: 1043.75 Up Trend,
- (Intermediate-Term) 20 Day: 1033.56 Up Trend,
- (Intermediate-Term) 55 Day: 1033.12 Neutral,
- (Long-Term) 100 Day: 1040.25 Down Trend,
- (Long-Term) 200 Day: 1044.25 Down Trend.
Additional Metrics
Recent Trade Signals
- 26 Aug 2025: Short ZS 11-25 @ 1053 Signals.USAR-WSFG
- 21 Aug 2025: Long ZS 11-25 @ 1049.25 Signals.USAR.TR120
Overall Rating
- Short-Term: Bullish,
- Intermediate-Term: Bullish,
- Long-Term: Neutral.
Key Insights Summary
Soybean futures have recently shown a strong upward momentum, with price action breaking above the monthly and yearly session fib grid centers, indicating a shift to bullish sentiment in both the intermediate and long-term outlooks. The short-term trend is also bullish, supported by a series of higher swing lows and a fast momentum move off the August lows. The 5, 10, and 20-day moving averages are all trending up, confirming the recent rally, while the 55-day is neutral and the 100/200-day averages remain in a downtrend, suggesting the longer-term trend is still in transition. Resistance is clustered near recent highs (1076.00, 1074.25, 1062.75), while support is established at 1025.00 and 1020.36, with a major swing low at 981.25. Recent trade signals show both long and short entries, reflecting the choppy, two-way action as the market tests upper resistance. Volatility remains elevated (ATR 82), and volume is robust, indicating active participation. Overall, the market is in a bullish phase short- and intermediate-term, but faces significant overhead resistance and is still working through a longer-term base-building process.
Chart Analysis ATS AI Generated: 2025-08-27 07:24 for Informational use only, not trading advice. Terms and Risk Disclosure Copyright © 2025. Algo Trading Systems LLC.
