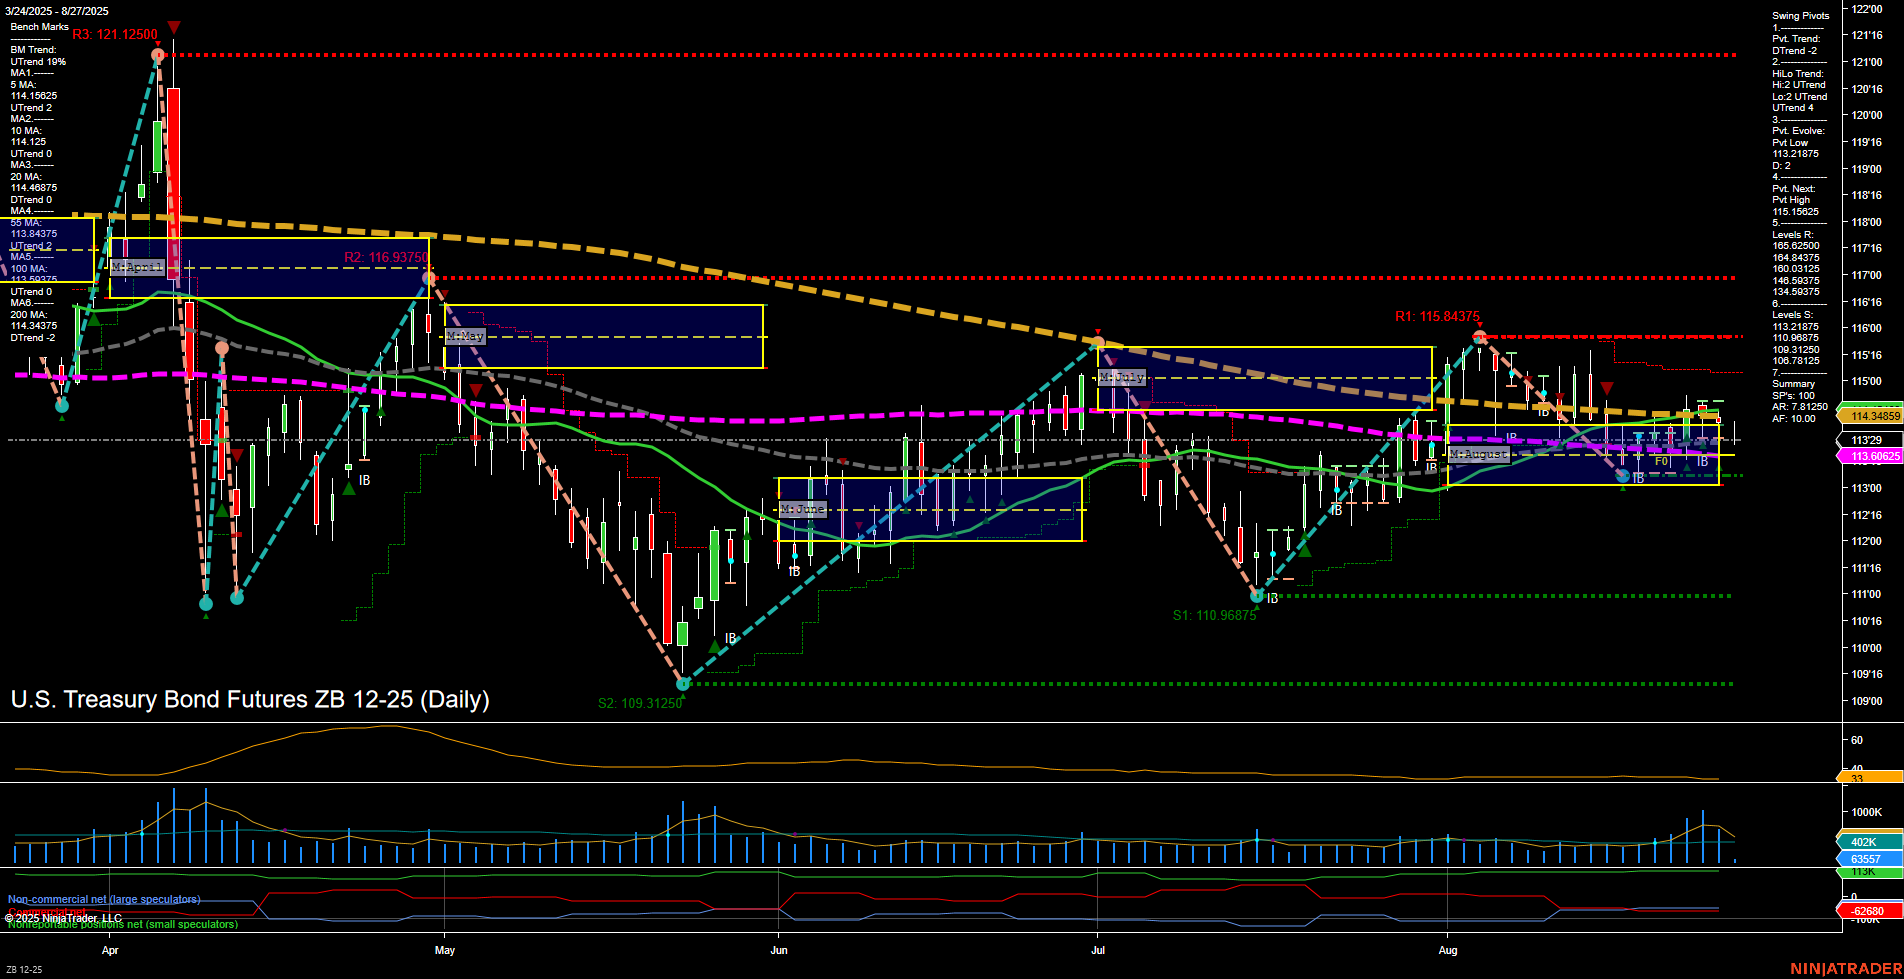
ZB U.S. Treasury Bond Futures Daily Chart Analysis: 2025-Aug-27 07:22 CT
Price Action
- Last: 113.29,
- Bars: Medium,
- Mom: Momentum slow.
WSFG Weekly
- Short-Term
- WSFG Current: NA%
- F0%/NTZ' Bias: Price Neutral,
- WSFG Trend: Neutral.
MSFG Month Aug
- Intermediate-Term
- MSFG Current: NA%
- F0%/NTZ' Bias: Price Neutral,
- MSFG Trend: Neutral.
YSFG Year 2025
- Long-Term
- YSFG Current: NA%
- F0%/NTZ' Bias: Price Neutral,
- YSFG Trend: Neutral.
Swing Pivots
- (Short-Term) 1. Pvt. Trend: DTrend,
- (Intermediate-Term) 2. HiLo Trend: UTrend,
- 3. Pvt. Evolve: Pvt Low 113.2875,
- 4. Pvt. Next: Pvt High 115.19525,
- 5. Levels R: 121.125, 116.9375, 115.84375,
- 6. Levels S: 110.96875, 110.3125, 109.3125.
Daily Benchmarks
- (Short-Term) 5 Day: 113.48 Down Trend,
- (Short-Term) 10 Day: 113.60 Down Trend,
- (Intermediate-Term) 20 Day: 114.34 Down Trend,
- (Intermediate-Term) 55 Day: 114.88 Down Trend,
- (Long-Term) 100 Day: 115.34 Down Trend,
- (Long-Term) 200 Day: 116.90 Down Trend.
Additional Metrics
Overall Rating
- Short-Term: Bearish,
- Intermediate-Term: Neutral,
- Long-Term: Bearish.
Key Insights Summary
The ZB U.S. Treasury Bond Futures daily chart is currently showing a period of consolidation within a neutral Monthly and Weekly Session Fib Grid, with price action contained inside the August NTZ. The short-term swing pivot trend is down (DTrend), and all benchmark moving averages from short to long-term are in a downtrend, reinforcing a bearish bias for both short and long-term perspectives. Intermediate-term HiLo pivots remain in an uptrend, suggesting some underlying support, but this is not yet reflected in price structure or moving averages. Resistance levels are stacked above at 115.84, 116.93, and 121.12, while support is found at 113.28, 110.96, and 110.31. ATR and volume metrics indicate moderate volatility and participation. Overall, the market is in a corrective or consolidative phase, with a bearish tilt dominating unless a significant reversal above the next swing high (115.19) occurs. The technical environment is choppy, with no clear breakout or breakdown, and price is testing lower support levels within a broader downtrend context.
Chart Analysis ATS AI Generated: 2025-08-27 07:23 for Informational use only, not trading advice. Terms and Risk Disclosure Copyright © 2025. Algo Trading Systems LLC.
