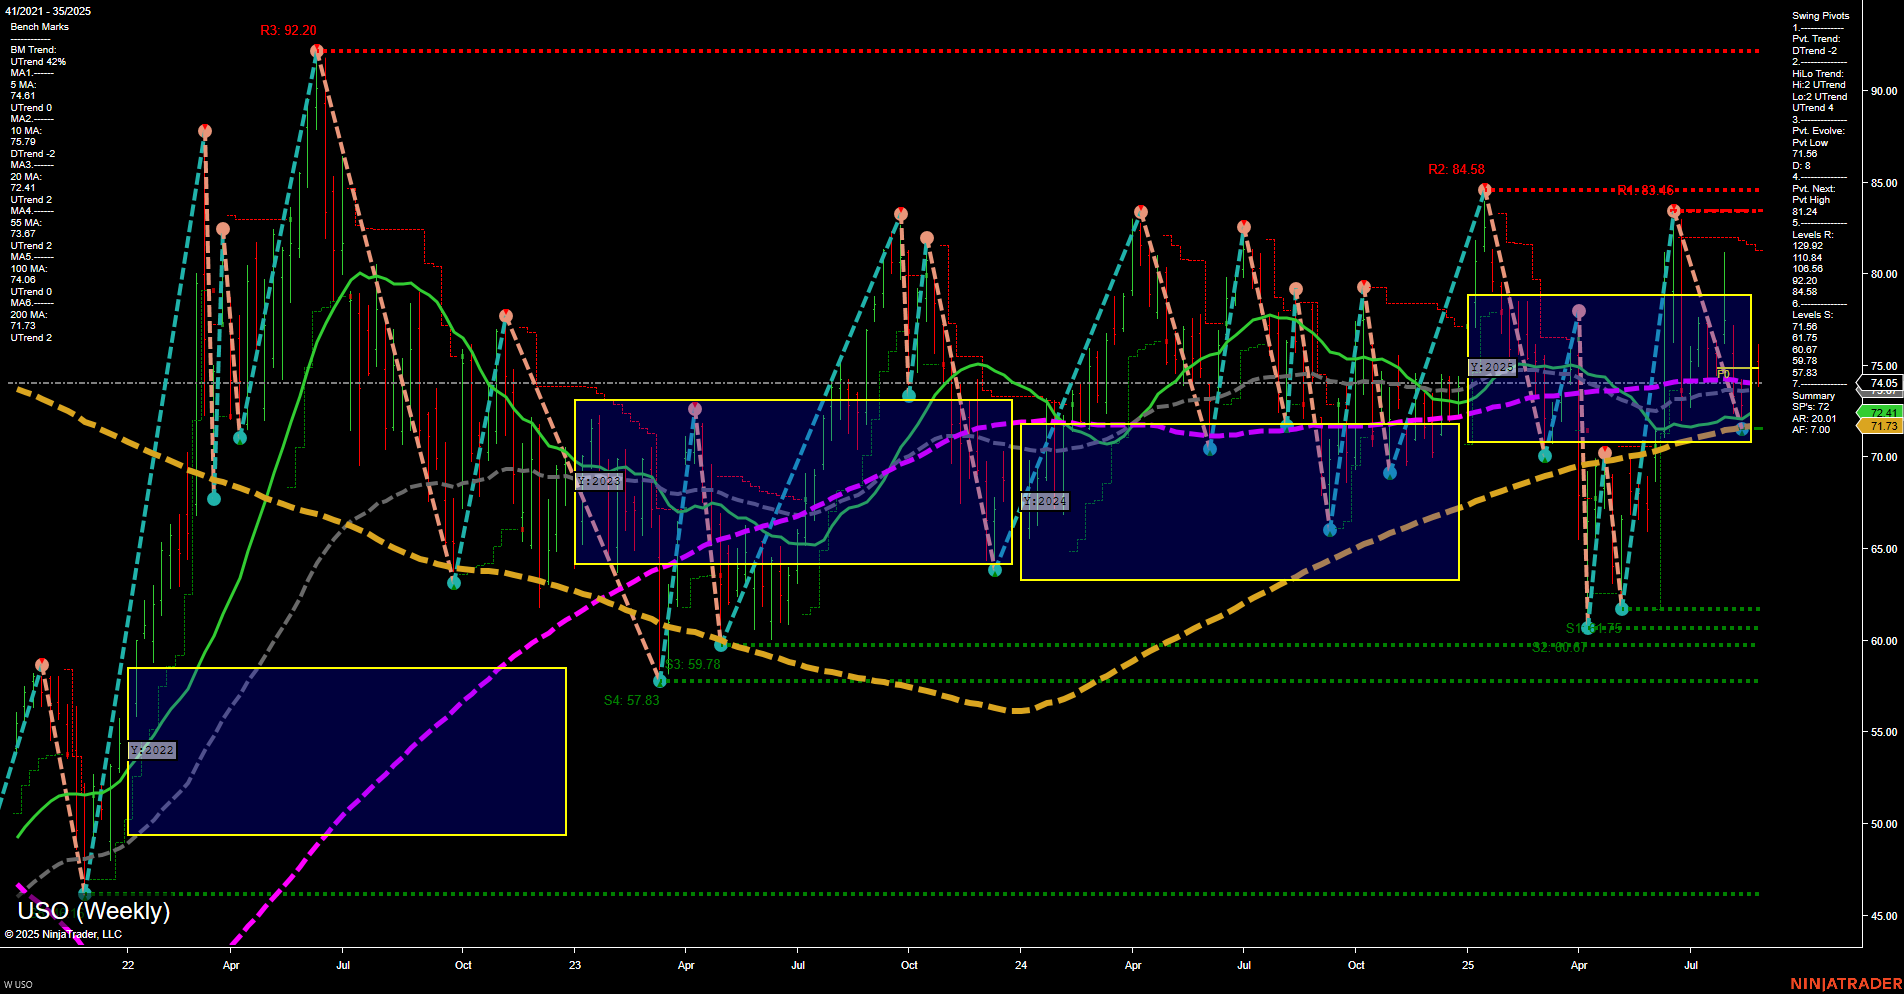
USO United States Oil Fund LP Weekly Chart Analysis: 2025-Aug-27 07:21 CT
Price Action
- Last: 74.05,
- Bars: Medium,
- Mom: Momentum slow.
WSFG Weekly
- Short-Term
- WSFG Current: NA%
- F0%/NTZ' Bias: Price Neutral,
- WSFG Trend: Neutral.
MSFG Month Aug
- Intermediate-Term
- MSFG Current: NA%
- F0%/NTZ' Bias: Price Neutral,
- MSFG Trend: Neutral.
YSFG Year 2025
- Long-Term
- YSFG Current: NA%
- F0%/NTZ' Bias: Price Neutral,
- YSFG Trend: Neutral.
Swing Pivots
- (Short-Term) 1. Pvt. Trend: DTrend,
- (Intermediate-Term) 2. HiLo Trend: UTrend,
- 3. Pvt. Evolve: Pvt Low 66.75,
- 4. Pvt. Next: Pvt High 83.46,
- 5. Levels R: 92.20, 84.58, 83.46, 81.24,
- 6. Levels S: 66.75, 60.17, 59.78, 57.83.
Weekly Benchmarks
- (Intermediate-Term) 5 Week: 74.61 Down Trend,
- (Intermediate-Term) 10 Week: 72.91 Down Trend,
- (Long-Term) 20 Week: 74.06 Down Trend,
- (Long-Term) 55 Week: 72.41 Up Trend,
- (Long-Term) 100 Week: 77.13 Down Trend,
- (Long-Term) 200 Week: 71.73 Up Trend.
Overall Rating
- Short-Term: Neutral,
- Intermediate-Term: Neutral,
- Long-Term: Neutral.
Key Insights Summary
The USO weekly chart reflects a market in consolidation, with price action oscillating within a broad neutral zone as indicated by the NTZ (yellow box) and a lack of directional bias across the session fib grids (WSFG, MSFG, YSFG). Momentum is slow and bars are of medium size, suggesting a lack of strong conviction from either buyers or sellers. The short-term swing pivot trend is down, but the intermediate-term HiLo trend remains up, highlighting mixed signals and a choppy environment. Key resistance levels are clustered in the low-to-mid 80s, while support is well-defined in the mid-60s to high-50s range. Most benchmark moving averages are trending down, except for the 55 and 200 week MAs, which are slightly up, reinforcing the overall neutral to slightly bearish undertone. The chart structure shows repeated tests and rejections at resistance, with higher lows forming above major support, indicative of a broad range-bound market. No clear breakout or breakdown is evident, and volatility appears contained. This environment is typical of a market awaiting a catalyst, with swing traders likely to focus on mean reversion and range strategies until a decisive trend emerges.
Chart Analysis ATS AI Generated: 2025-08-27 07:22 for Informational use only, not trading advice. Terms and Risk Disclosure Copyright © 2025. Algo Trading Systems LLC.
