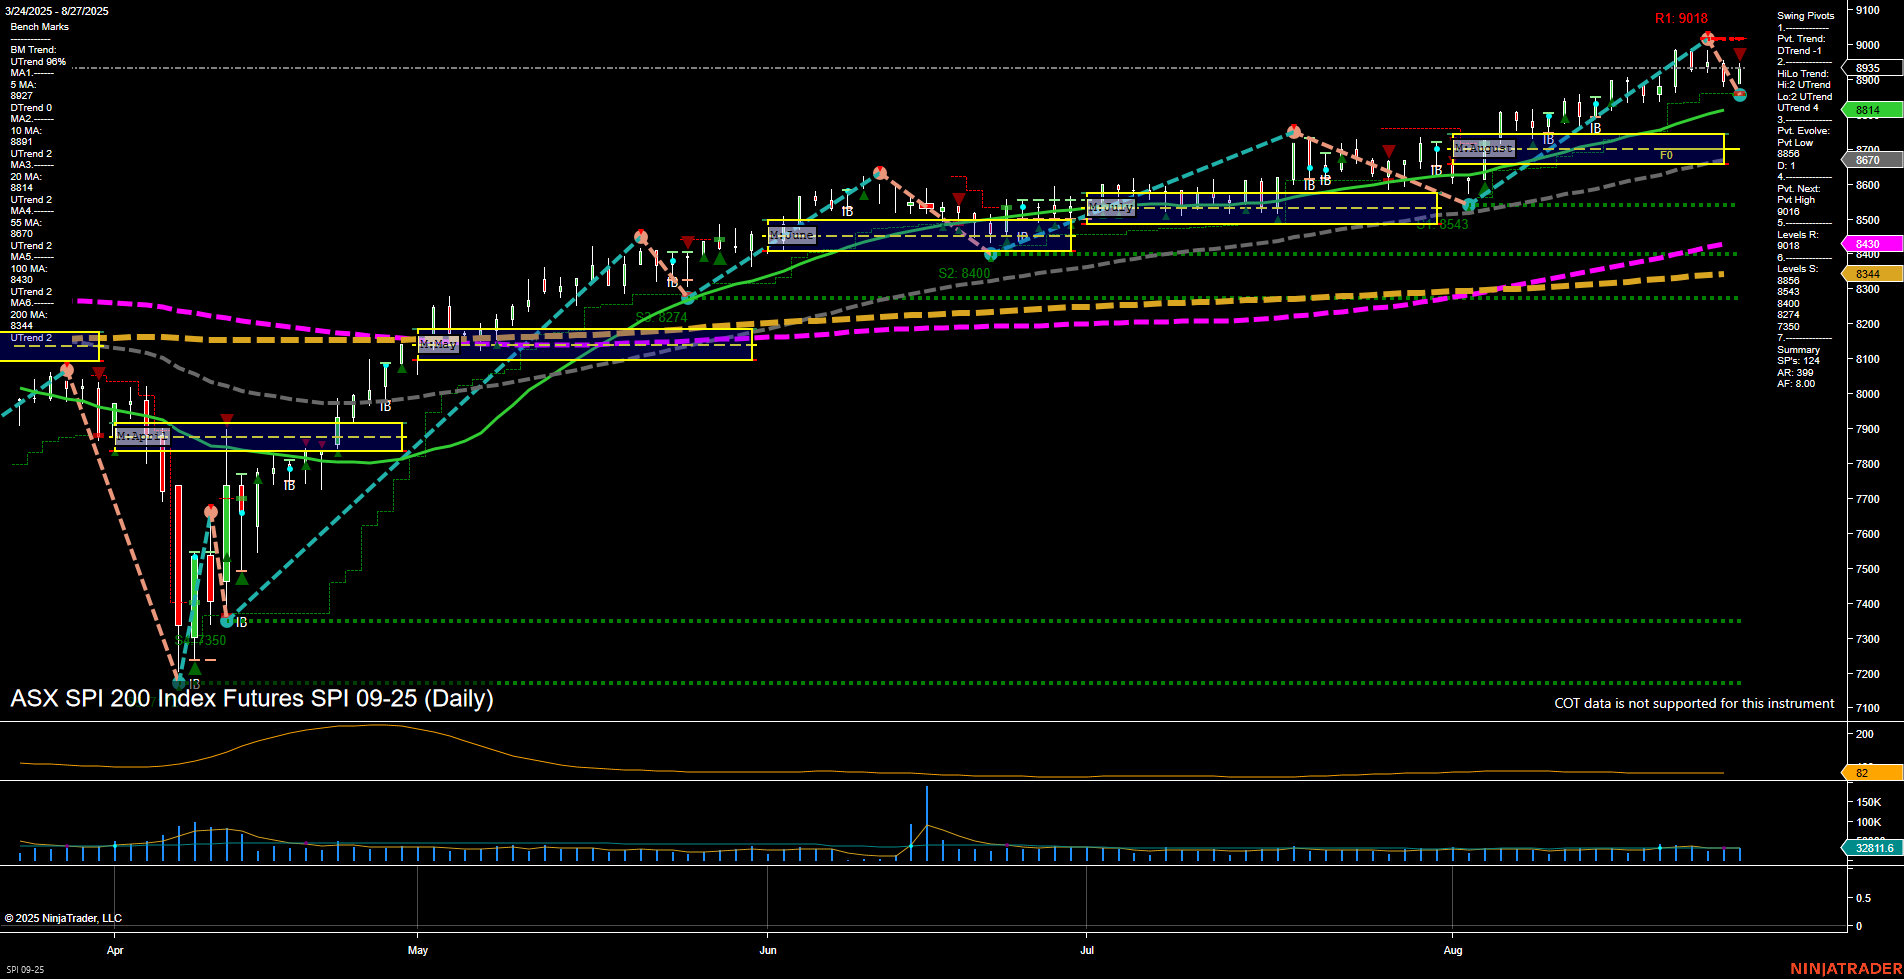
SPI ASX SPI 200 Index Futures Daily Chart Analysis: 2025-Aug-27 07:19 CT
Price Action
- Last: 8814,
- Bars: Medium,
- Mom: Momentum average.
WSFG Weekly
- Short-Term
- WSFG Current: NA%
- F0%/NTZ' Bias: Price Neutral,
- WSFG Trend: Neutral.
MSFG Month Aug
- Intermediate-Term
- MSFG Current: NA%
- F0%/NTZ' Bias: Price Neutral,
- MSFG Trend: Neutral.
YSFG Year 2025
- Long-Term
- YSFG Current: NA%
- F0%/NTZ' Bias: Price Neutral,
- YSFG Trend: Neutral.
Swing Pivots
- (Short-Term) 1. Pvt. Trend: DTrend,
- (Intermediate-Term) 2. HiLo Trend: UTrend,
- 3. Pvt. Evolve: Pvt High 9018,
- 4. Pvt. Next: Pvt Low 8670,
- 5. Levels R: 9018,
- 6. Levels S: 8670, 8430, 8344.
Daily Benchmarks
- (Short-Term) 5 Day: 8935 Down Trend,
- (Short-Term) 10 Day: 8897 Down Trend,
- (Intermediate-Term) 20 Day: 8814 Up Trend,
- (Intermediate-Term) 55 Day: 8500 Up Trend,
- (Long-Term) 100 Day: 8430 Up Trend,
- (Long-Term) 200 Day: 8344 Up Trend.
Additional Metrics
Overall Rating
- Short-Term: Bearish,
- Intermediate-Term: Bullish,
- Long-Term: Bullish.
Key Insights Summary
The SPI 200 Index Futures daily chart shows a recent shift in short-term momentum, with the current swing pivot trend turning down (DTrend) after a strong rally to a new high at 9018. Price has pulled back below the short-term moving averages (5 and 10 day), both of which are now in a downtrend, indicating short-term weakness. However, the intermediate and long-term moving averages (20, 55, 100, 200 day) remain in solid uptrends, reflecting underlying bullish structure. The intermediate-term swing pivot trend (HiLo) is still up, and key support levels are clustered at 8670, 8430, and 8344, suggesting areas where buyers may step in if the pullback continues. Volatility (ATR) is moderate, and volume remains steady. Overall, the market is experiencing a corrective phase within a broader uptrend, with short-term bearish signals but intermediate and long-term bullish momentum still intact. This environment often leads to choppy price action as the market digests recent gains and tests support levels.
Chart Analysis ATS AI Generated: 2025-08-27 07:19 for Informational use only, not trading advice. Terms and Risk Disclosure Copyright © 2025. Algo Trading Systems LLC.
