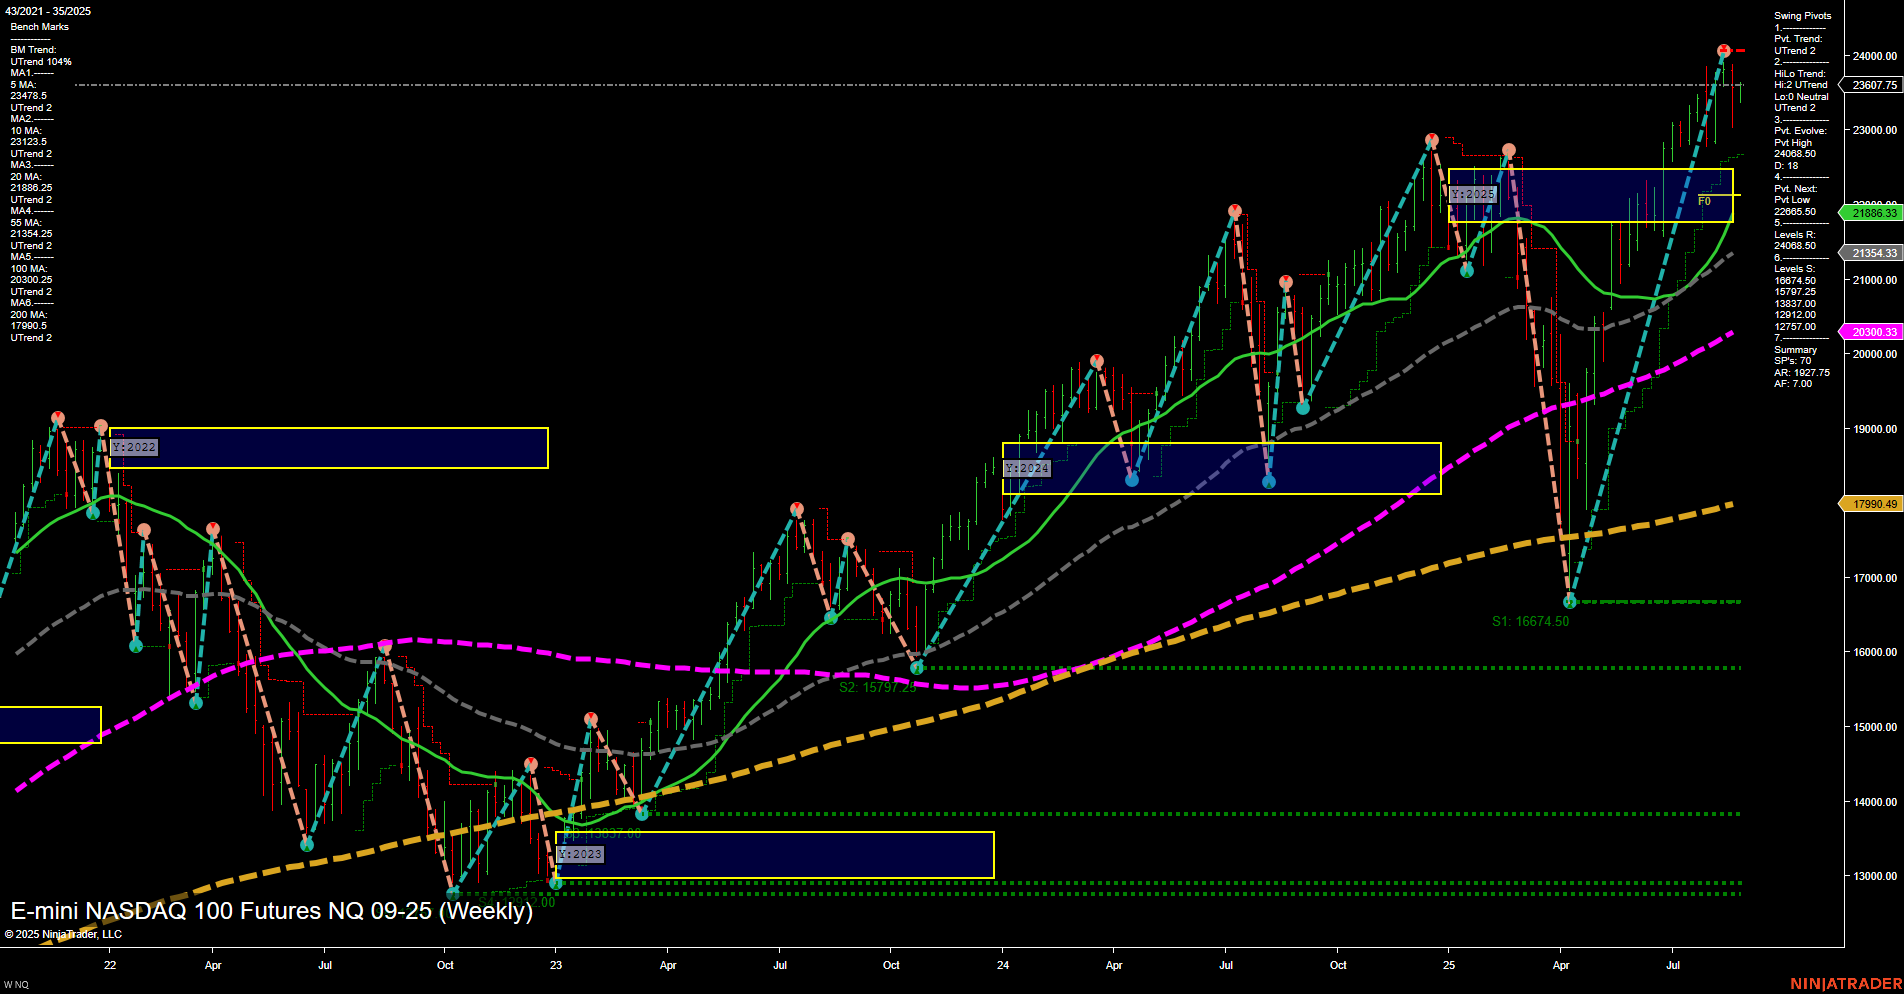
NQ E-mini NASDAQ 100 Futures Weekly Chart Analysis: 2025-Aug-27 07:16 CT
Price Action
- Last: 23,607.75,
- Bars: Medium,
- Mom: Momentum average.
WSFG Weekly
- Short-Term
- WSFG Current: 1%
- F0%/NTZ' Bias: Price Above,
- WSFG Trend: Up.
MSFG Month Aug
- Intermediate-Term
- MSFG Current: 21%
- F0%/NTZ' Bias: Price Above,
- MSFG Trend: Up.
YSFG Year 2025
- Long-Term
- YSFG Current: 41%
- F0%/NTZ' Bias: Price Above,
- YSFG Trend: Up.
Swing Pivots
- (Short-Term) 1. Pvt. Trend: UTrend,
- (Intermediate-Term) 2. HiLo Trend: UTrend,
- 3. Pvt. Evolve: Pvt High 24,000,
- 4. Pvt. Next: Pvt Low 21,000,
- 5. Levels R: 24,000, 23,607.75,
- 6. Levels S: 21,000, 20,000, 18,365, 17,277, 16,674, 15,797, 13,877, 12,707.
Weekly Benchmarks
- (Intermediate-Term) 5 Week: 23,478.25 Up Trend,
- (Intermediate-Term) 10 Week: 23,123.5 Up Trend,
- (Long-Term) 20 Week: 21,868.33 Up Trend,
- (Long-Term) 55 Week: 21,353.43 Up Trend,
- (Long-Term) 100 Week: 20,303.93 Up Trend,
- (Long-Term) 200 Week: 17,990.49 Up Trend.
Recent Trade Signals
- 27 Aug 2025: Long NQ 09-25 @ 23,597 Signals.USAR-MSFG
- 26 Aug 2025: Short NQ 09-25 @ 23,454 Signals.USAR-WSFG
- 22 Aug 2025: Long NQ 09-25 @ 23,606.25 Signals.USAR.TR120
- 20 Aug 2025: Short NQ 09-25 @ 23,344.5 Signals.USAR.TR720
Overall Rating
- Short-Term: Bullish,
- Intermediate-Term: Bullish,
- Long-Term: Bullish.
Key Insights Summary
The NQ E-mini NASDAQ 100 Futures weekly chart shows a strong bullish structure across all timeframes. Price is trading above all major moving averages, with each benchmark MA trending upward, confirming sustained momentum. The most recent swing pivot is a high at 24,000, with the next significant support at 21,000, indicating a wide range for potential retracement but with higher lows consistently forming. The WSFG, MSFG, and YSFG all show price above their respective NTZ/F0% levels, reinforcing the uptrend bias. Recent trade signals reflect both long and short entries, but the prevailing direction is upward, supported by the majority of technical metrics. The market has recovered from previous corrections, forming a V-shaped recovery and continuing to make new highs, suggesting trend continuation rather than consolidation. Volatility remains present, but the overall structure favors the bulls, with higher resistance levels being tested and support levels holding firm.
Chart Analysis ATS AI Generated: 2025-08-27 07:16 for Informational use only, not trading advice. Terms and Risk Disclosure Copyright © 2025. Algo Trading Systems LLC.
