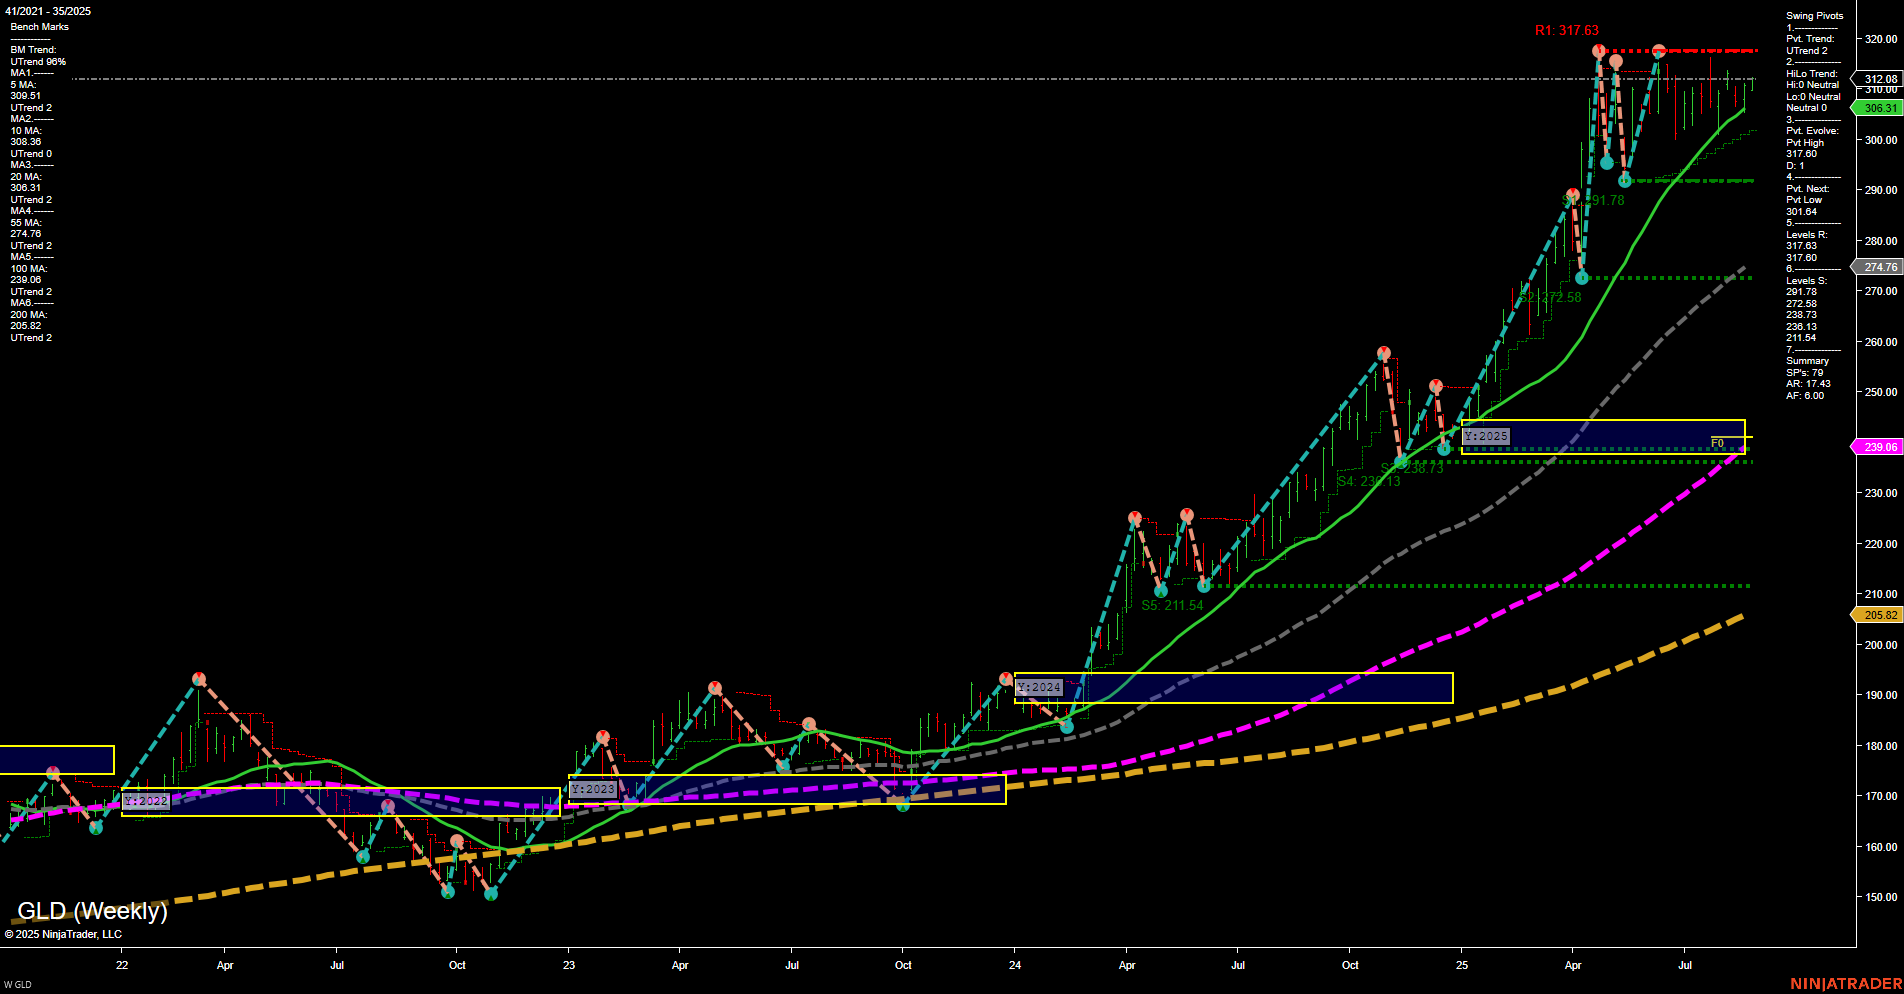
GLD SPDR Gold Shares Weekly Chart Analysis: 2025-Aug-27 07:13 CT
Price Action
- Last: 310.01,
- Bars: Small,
- Mom: Momentum slow.
WSFG Weekly
- Short-Term
- WSFG Current: NA%
- F0%/NTZ' Bias: Price Neutral,
- WSFG Trend: Neutral.
MSFG Month Aug
- Intermediate-Term
- MSFG Current: NA%
- F0%/NTZ' Bias: Price Neutral,
- MSFG Trend: Neutral.
YSFG Year 2025
- Long-Term
- YSFG Current: NA%
- F0%/NTZ' Bias: Price Neutral,
- YSFG Trend: Neutral.
Swing Pivots
- (Short-Term) 1. Pvt. Trend: UTrend 2,
- (Intermediate-Term) 2. HiLo Trend: UTrend 2,
- 3. Pvt. Evolve: Pvt high 317.60,
- 4. Pvt. Next: Pvt low 301.64,
- 5. Levels R: 317.60, 312.08,
- 6. Levels S: 301.64, 291.78, 272.58, 239.13, 211.54.
Weekly Benchmarks
- (Intermediate-Term) 5 Week: 309.51 Up Trend,
- (Intermediate-Term) 10 Week: 308.86 Up Trend,
- (Long-Term) 20 Week: 303.31 Up Trend,
- (Long-Term) 55 Week: 274.76 Up Trend,
- (Long-Term) 100 Week: 239.08 Up Trend,
- (Long-Term) 200 Week: 205.82 Up Trend.
Overall Rating
- Short-Term: Neutral,
- Intermediate-Term: Bullish,
- Long-Term: Bullish.
Key Insights Summary
GLD is consolidating near all-time highs after a strong multi-month rally, with price action showing small bars and slow momentum, indicating a pause or digestion phase. Both short-term and intermediate-term swing pivots remain in uptrends, but resistance at 317.60 is capping further upside for now. Support is layered below at 301.64 and 291.78, with major long-term support at the 20, 55, and 100 week moving averages, all trending higher. The overall structure is bullish on intermediate and long-term timeframes, with the current range-bound action suggesting a potential base-building phase before the next directional move. No clear breakout or breakdown is evident, so futures swing traders may interpret this as a market in consolidation, awaiting a catalyst for renewed trend direction.
Chart Analysis ATS AI Generated: 2025-08-27 07:13 for Informational use only, not trading advice. Terms and Risk Disclosure Copyright © 2025. Algo Trading Systems LLC.
