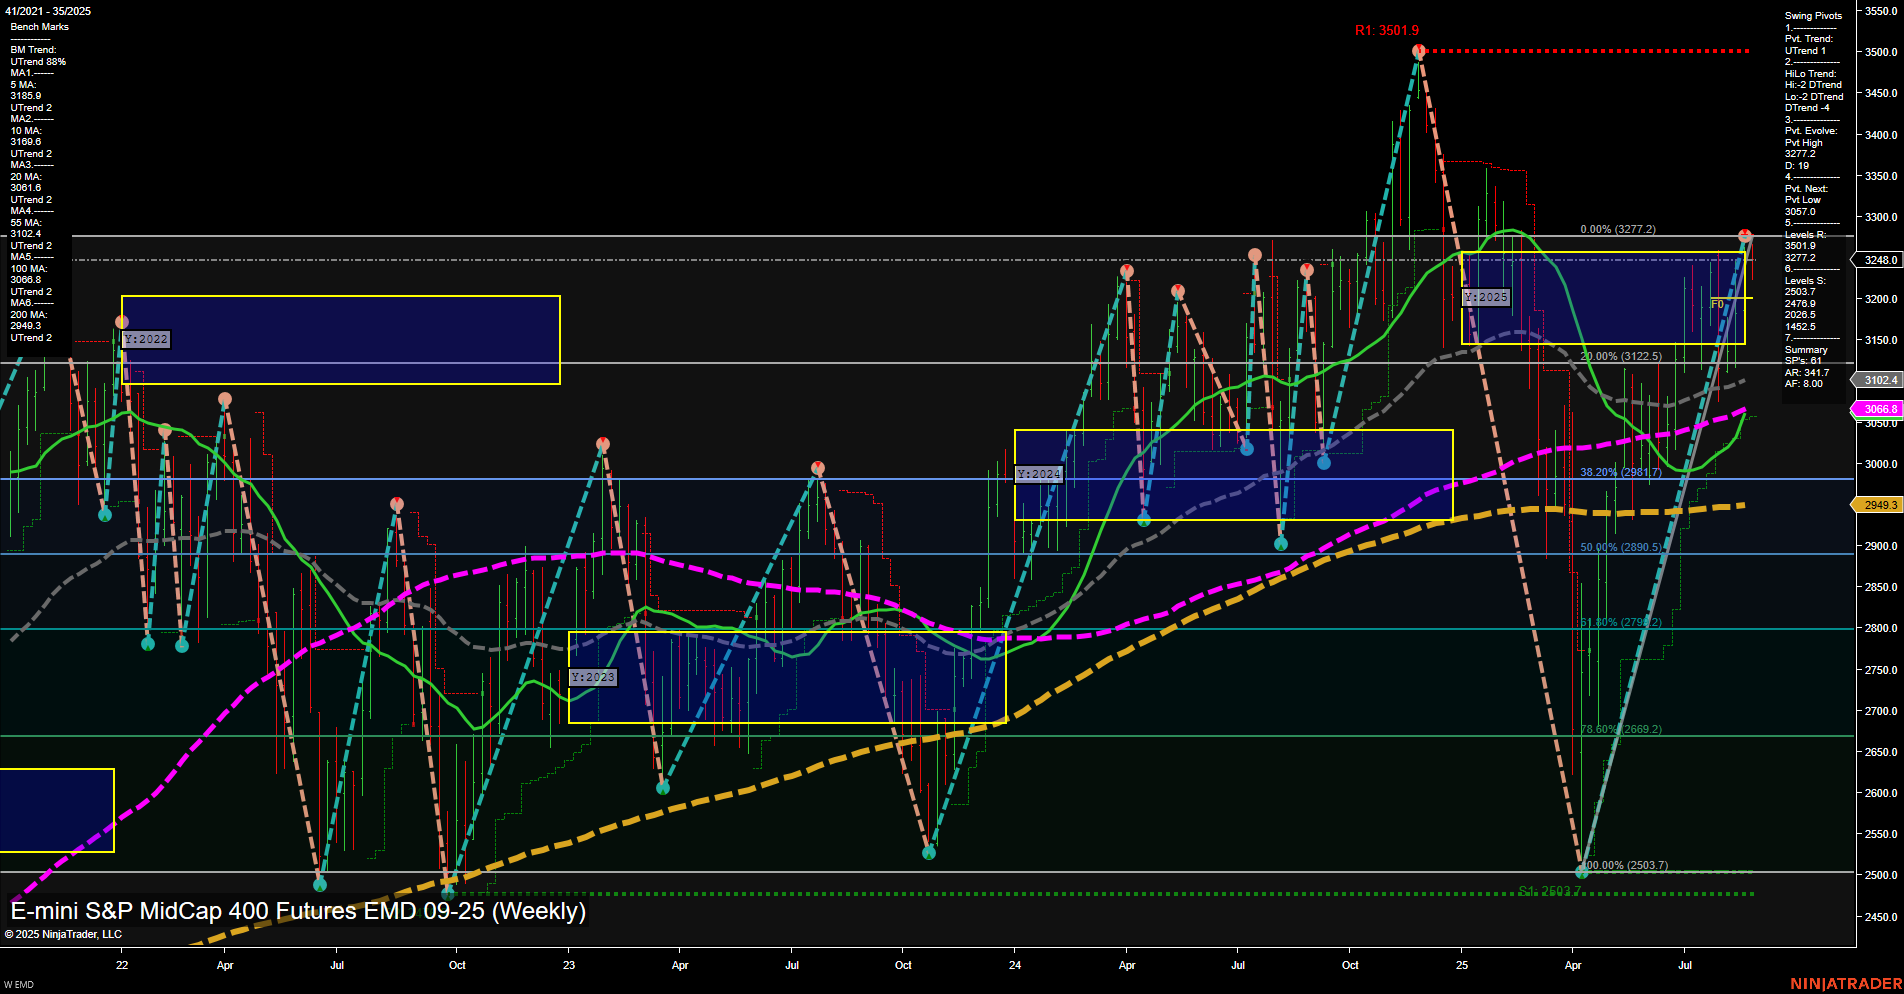
EMD E-mini S&P MidCap 400 Futures Weekly Chart Analysis: 2025-Aug-27 07:08 CT
Price Action
- Last: 3248.0,
- Bars: Large,
- Mom: Momentum fast.
WSFG Weekly
- Short-Term
- WSFG Current: -15%
- F0%/NTZ' Bias: Price Below,
- WSFG Trend: Down.
MSFG Month Aug
- Intermediate-Term
- MSFG Current: 50%
- F0%/NTZ' Bias: Price Above,
- MSFG Trend: Up.
YSFG Year 2025
- Long-Term
- YSFG Current: 8%
- F0%/NTZ' Bias: Price Above,
- YSFG Trend: Up.
Swing Pivots
- (Short-Term) 1. Pvt. Trend: UTrend,
- (Intermediate-Term) 2. HiLo Trend: DTrend,
- 3. Pvt. Evolve: Pvt high 3277.2,
- 4. Pvt. Next: Pvt low 3019.4,
- 5. Levels R: 3501.9, 3277.2,
- 6. Levels S: 3019.4, 2607.2.
Weekly Benchmarks
- (Intermediate-Term) 5 Week: 3102.4 Up Trend,
- (Intermediate-Term) 10 Week: 3068.6 Up Trend,
- (Long-Term) 20 Week: 3102.4 Up Trend,
- (Long-Term) 55 Week: 3068.6 Up Trend,
- (Long-Term) 100 Week: 3008.3 Up Trend,
- (Long-Term) 200 Week: 2949.3 Up Trend.
Recent Trade Signals
- 26 Aug 2025: Long EMD 09-25 @ 3258.2 Signals.USAR.TR120
- 25 Aug 2025: Short EMD 09-25 @ 3246.6 Signals.USAR-WSFG
- 22 Aug 2025: Long EMD 09-25 @ 3191.5 Signals.USAR-MSFG
Overall Rating
- Short-Term: Neutral
- Intermediate-Term: Bullish
- Long-Term: Bullish
Key Insights Summary
The EMD futures market is currently experiencing high volatility, as indicated by large bars and fast momentum. Short-term price action is mixed, with the WSFG showing a downward trend and price below the NTZ, but the swing pivot trend is up, suggesting a possible short-term bounce or retracement within a broader pullback. Intermediate-term and long-term trends remain bullish, supported by the MSFG and YSFG both trending up and price holding above key moving averages. The most recent swing high at 3277.2 acts as immediate resistance, while 3019.4 is the next significant support. The market has recently generated both long and short signals, reflecting choppy, two-way action near resistance. Overall, the structure suggests a market in consolidation after a strong rally, with potential for further upside if resistance is cleared, but also risk of deeper pullbacks if support levels break. The technical backdrop remains constructive for bulls on higher timeframes, but short-term traders should be alert to rapid swings and possible false breakouts.
Chart Analysis ATS AI Generated: 2025-08-27 07:08 for Informational use only, not trading advice. Terms and Risk Disclosure Copyright © 2025. Algo Trading Systems LLC.
