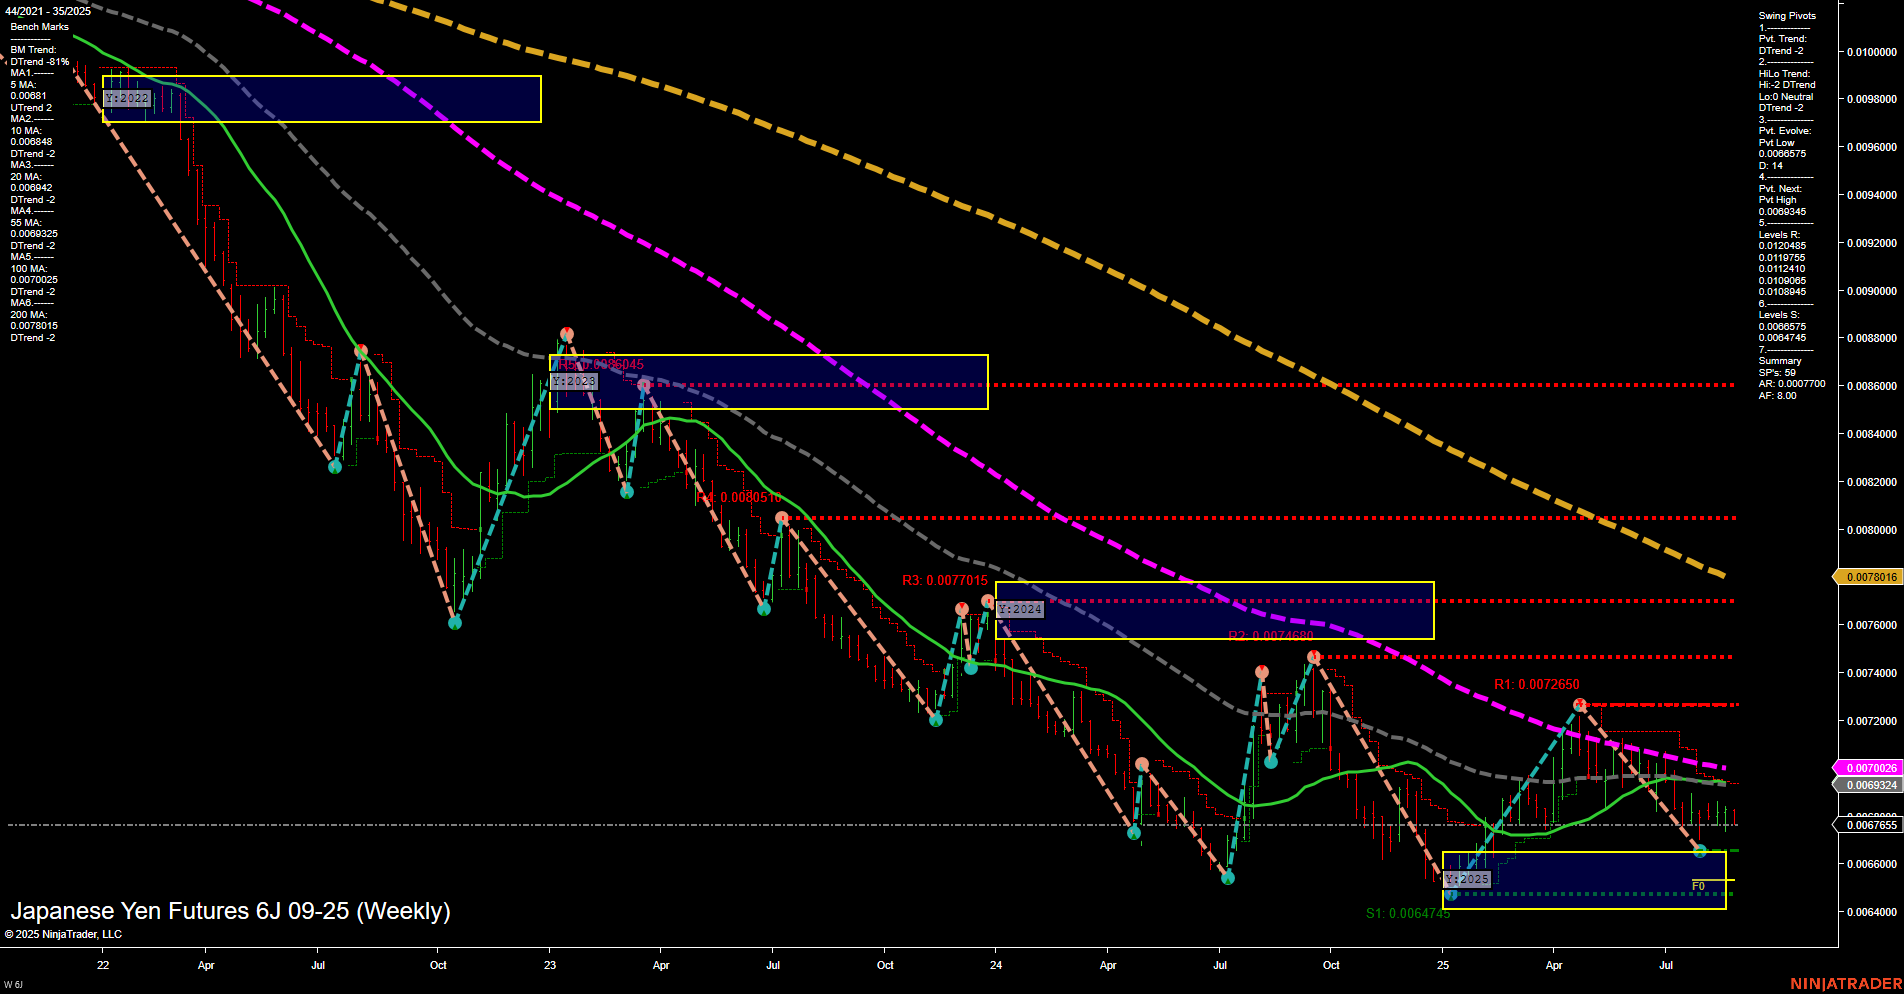
6J Japanese Yen Futures Weekly Chart Analysis: 2025-Aug-27 07:03 CT
Price Action
- Last: 0.0067816,
- Bars: Small,
- Mom: Momentum slow.
WSFG Weekly
- Short-Term
- WSFG Current: -55%
- F0%/NTZ' Bias: Price Below,
- WSFG Trend: Down.
MSFG Month Aug
- Intermediate-Term
- MSFG Current: 34%
- F0%/NTZ' Bias: Price Above,
- MSFG Trend: Up.
YSFG Year 2025
- Long-Term
- YSFG Current: 20%
- F0%/NTZ' Bias: Price Above,
- YSFG Trend: Up.
Swing Pivots
- (Short-Term) 1. Pvt. Trend: DTrend,
- (Intermediate-Term) 2. HiLo Trend: DTrend,
- 3. Pvt. Evolve: Pvt low 0.0064745,
- 4. Pvt. Next: Pvt high 0.0072045,
- 5. Levels R: 0.0083045, 0.0080510, 0.0077015, 0.0074600, 0.0072650,
- 6. Levels S: 0.0064745, 0.0063775, 0.0063445, 0.0063000, 0.0062770.
Weekly Benchmarks
- (Intermediate-Term) 5 Week: 0.0069241 Down Trend,
- (Intermediate-Term) 10 Week: 0.0070206 Down Trend,
- (Long-Term) 20 Week: 0.0070816 Down Trend,
- (Long-Term) 55 Week: 0.0077026 Down Trend,
- (Long-Term) 100 Week: 0.0080481 Down Trend,
- (Long-Term) 200 Week: 0.0089448 Down Trend.
Recent Trade Signals
- 27 Aug 2025: Short 6J 09-25 @ 0.006769 Signals.USAR.TR120
- 26 Aug 2025: Short 6J 09-25 @ 0.0068035 Signals.USAR-WSFG
Overall Rating
- Short-Term: Bearish,
- Intermediate-Term: Bearish,
- Long-Term: Bearish.
Key Insights Summary
The Japanese Yen futures (6J) weekly chart continues to reflect a dominant bearish environment across all timeframes. Price action is subdued, with small bars and slow momentum, indicating a lack of strong buying interest and a tendency toward consolidation near recent lows. The Weekly Session Fib Grid (WSFG) shows price below the NTZ center, confirming a short-term downtrend, while both swing pivot trends (short and intermediate) remain in decline, with the most recent pivots marking lower highs and lower lows. All benchmark moving averages from 5 to 200 weeks are trending down, reinforcing the persistent long-term weakness. Recent trade signals have triggered new short entries, aligning with the prevailing trend. Despite some intermediate and yearly session fib grid metrics showing price above their NTZ centers, the overall technical structure remains pressured by resistance overhead and a lack of bullish reversal signals. The market is in a prolonged downtrend, with any rallies so far being corrective rather than trend-changing, and support levels are being tested repeatedly without significant follow-through to the upside.
Chart Analysis ATS AI Generated: 2025-08-27 07:04 for Informational use only, not trading advice. Terms and Risk Disclosure Copyright © 2025. Algo Trading Systems LLC.
