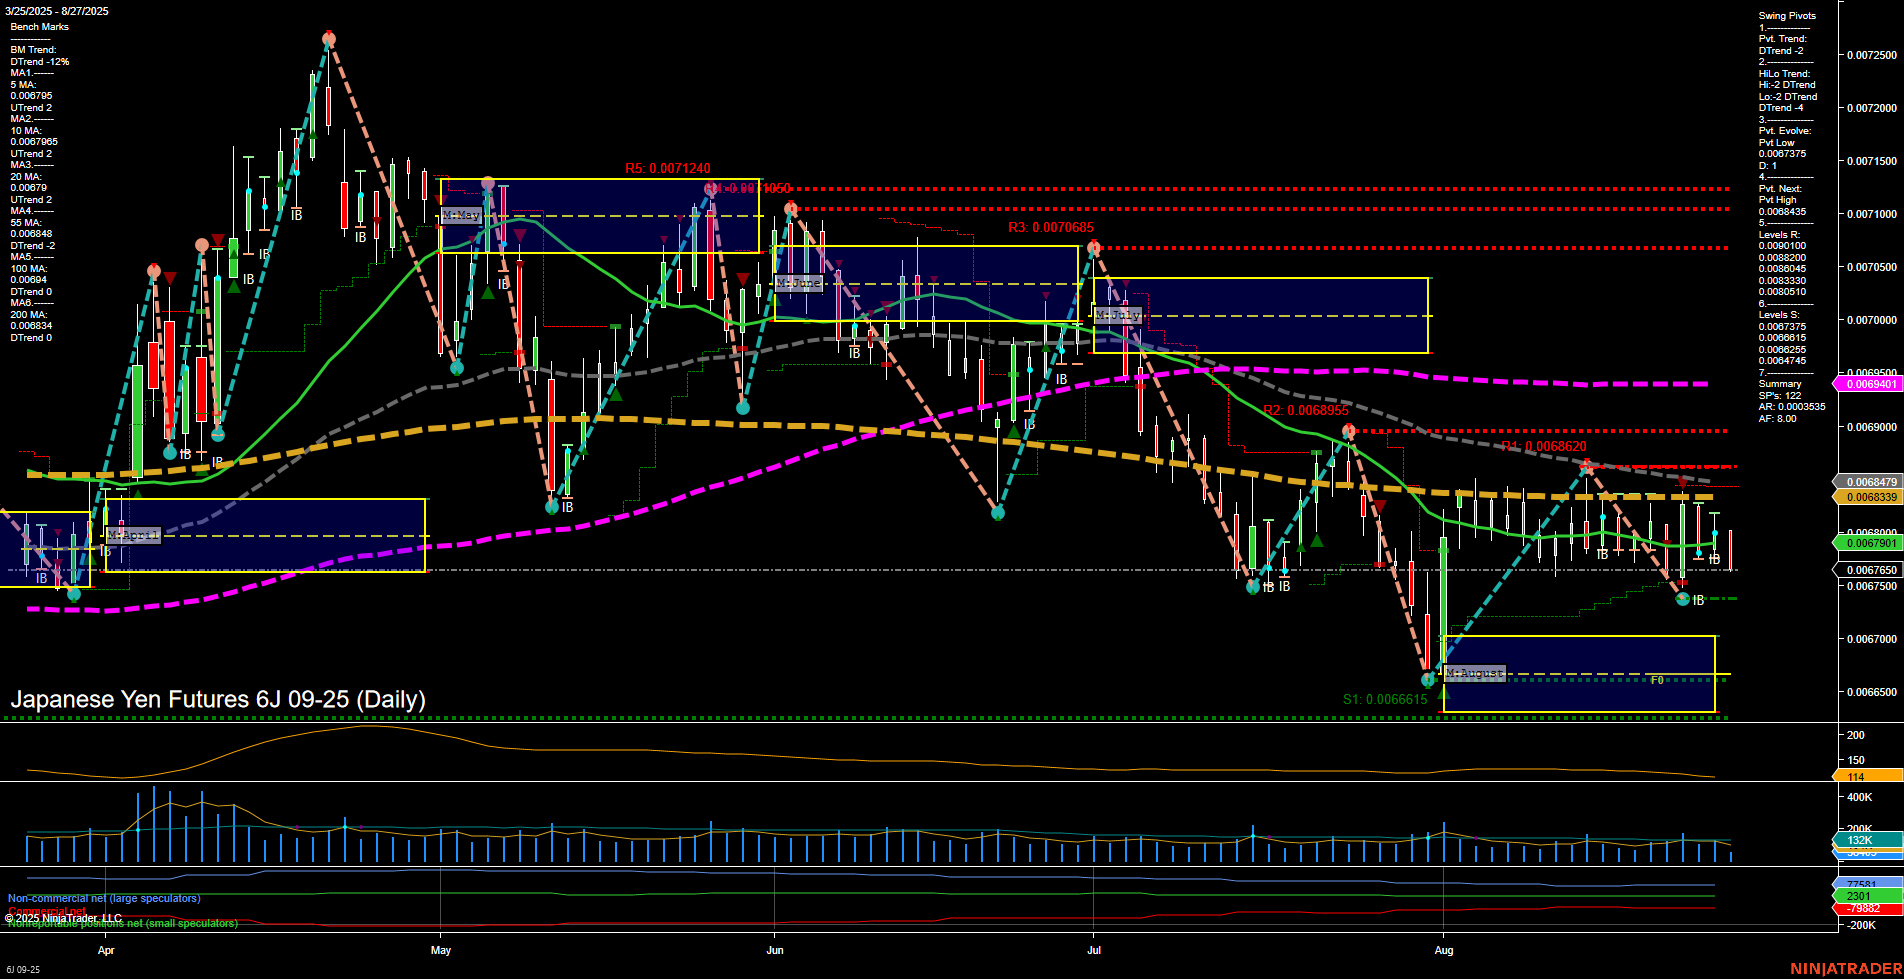
6J Japanese Yen Futures Daily Chart Analysis: 2025-Aug-27 07:03 CT
Price Action
- Last: 0.006769,
- Bars: Medium,
- Mom: Momentum slow.
WSFG Weekly
- Short-Term
- WSFG Current: -55%
- F0%/NTZ' Bias: Price Below,
- WSFG Trend: Down.
MSFG Month Aug
- Intermediate-Term
- MSFG Current: 34%
- F0%/NTZ' Bias: Price Above,
- MSFG Trend: Up.
YSFG Year 2025
- Long-Term
- YSFG Current: 20%
- F0%/NTZ' Bias: Price Above,
- YSFG Trend: Up.
Swing Pivots
- (Short-Term) 1. Pvt. Trend: DTrend,
- (Intermediate-Term) 2. HiLo Trend: DTrend,
- 3. Pvt. Evolve: Pvt Low 0.0067375,
- 4. Pvt. Next: Pvt High 0.0068435,
- 5. Levels R: 0.0071240, 0.0070650, 0.0068955, 0.0068620, 0.0068435,
- 6. Levels S: 0.0067375, 0.0066615, 0.0064745.
Daily Benchmarks
- (Short-Term) 5 Day: 0.006785 Down Trend,
- (Short-Term) 10 Day: 0.006789 Down Trend,
- (Intermediate-Term) 20 Day: 0.006850 Down Trend,
- (Intermediate-Term) 55 Day: 0.006944 Down Trend,
- (Long-Term) 100 Day: 0.006991 Down Trend,
- (Long-Term) 200 Day: 0.006834 Down Trend.
Additional Metrics
Recent Trade Signals
- 27 Aug 2025: Short 6J 09-25 @ 0.006769 Signals.USAR.TR120
- 26 Aug 2025: Short 6J 09-25 @ 0.0068035 Signals.USAR-WSFG
Overall Rating
- Short-Term: Bearish,
- Intermediate-Term: Bearish,
- Long-Term: Bearish.
Key Insights Summary
The 6J Japanese Yen futures daily chart shows a market under persistent downside pressure. Price action is characterized by medium-sized bars and slow momentum, indicating a lack of strong directional conviction but a steady drift lower. The short-term WSFG trend is decisively down, with price trading below the NTZ center, and both the short-term and intermediate-term swing pivot trends are in DTrend (downtrend) mode. All benchmark moving averages from short to long term are trending down, reinforcing the prevailing bearish structure. Resistance levels are stacked above current price, while support is clustered near recent lows, suggesting the market is testing lower boundaries with little sign of reversal. Recent trade signals have triggered new short entries, aligning with the overall technical setup. Despite the intermediate and long-term session fib grids showing price above their respective NTZ centers, the dominant trend remains bearish across all timeframes, with no clear evidence of a base or reversal pattern forming. Volatility and volume are moderate, supporting the view of a controlled, grinding decline rather than a panic-driven selloff.
Chart Analysis ATS AI Generated: 2025-08-27 07:03 for Informational use only, not trading advice. Terms and Risk Disclosure Copyright © 2025. Algo Trading Systems LLC.
