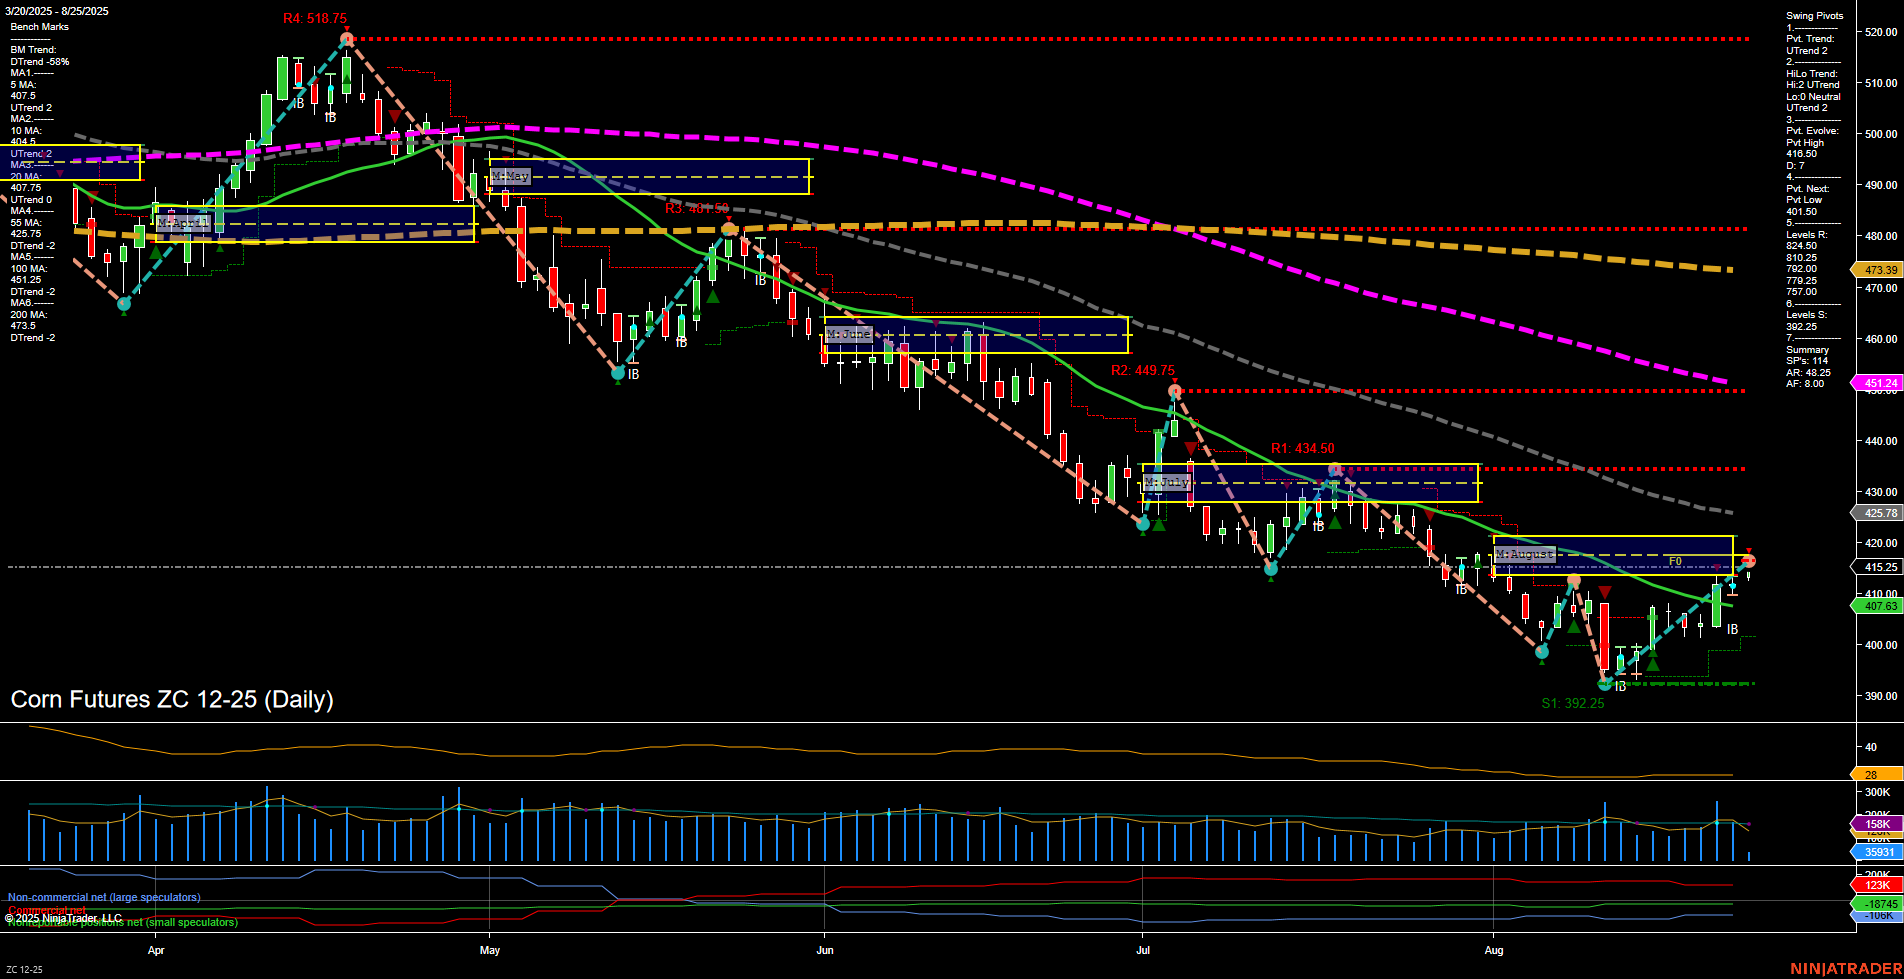
ZC Corn Futures Daily Chart Analysis: 2025-Aug-25 07:19 CT
Price Action
- Last: 416.0,
- Bars: Medium,
- Mom: Momentum average.
WSFG Weekly
- Short-Term
- WSFG Current: 10%
- F0%/NTZ' Bias: Price Above,
- WSFG Trend: Up.
MSFG Month Aug
- Intermediate-Term
- MSFG Current: -11%
- F0%/NTZ' Bias: Price Below,
- MSFG Trend: Down.
YSFG Year 2025
- Long-Term
- YSFG Current: -52%
- F0%/NTZ' Bias: Price Below,
- YSFG Trend: Down.
Swing Pivots
- (Short-Term) 1. Pvt. Trend: UTrend,
- (Intermediate-Term) 2. HiLo Trend: UTrend,
- 3. Pvt. Evolve: Pvt High 416.50,
- 4. Pvt. Next: Pvt Low 401.50,
- 5. Levels R: 518.75, 449.75, 434.50, 401.50,
- 6. Levels S: 392.25.
Daily Benchmarks
- (Short-Term) 5 Day: 407.63 Up Trend,
- (Short-Term) 10 Day: 415.25 Up Trend,
- (Intermediate-Term) 20 Day: 425.78 Down Trend,
- (Intermediate-Term) 55 Day: 451.24 Down Trend,
- (Long-Term) 100 Day: 473.39 Down Trend,
- (Long-Term) 200 Day: 491.05 Down Trend.
Additional Metrics
Recent Trade Signals
- 21 Aug 2025: Long ZC 12-25 @ 408.5 Signals.USAR-WSFG
- 19 Aug 2025: Long ZC 12-25 @ 402.5 Signals.USAR.TR720
Overall Rating
- Short-Term: Bullish,
- Intermediate-Term: Neutral,
- Long-Term: Bearish.
Key Insights Summary
Corn futures have recently shifted to a short-term uptrend, as indicated by the swing pivot UTrend and both 5-day and 10-day moving averages turning upward. Price has moved above the weekly session fib grid (WSFG) NTZ center, confirming short-term bullish momentum, and recent trade signals have triggered new long entries. However, the intermediate and long-term outlooks remain cautious, with price still below the monthly and yearly session fib grid centers and all major intermediate and long-term moving averages trending down. The market is currently testing resistance near the 416.50 swing high, with the next key resistance at 449.75 and support at 401.50 and 392.25. Volatility is moderate, and volume is steady, suggesting a potential for further short-term upside, but the broader trend remains under pressure from higher timeframe resistance and persistent downtrends. This setup reflects a classic countertrend rally within a larger bearish structure, with the potential for either a continuation higher if resistance breaks or a resumption of the dominant downtrend if rejected.
Chart Analysis ATS AI Generated: 2025-08-25 07:19 for Informational use only, not trading advice. Terms and Risk Disclosure Copyright © 2025. Algo Trading Systems LLC.
