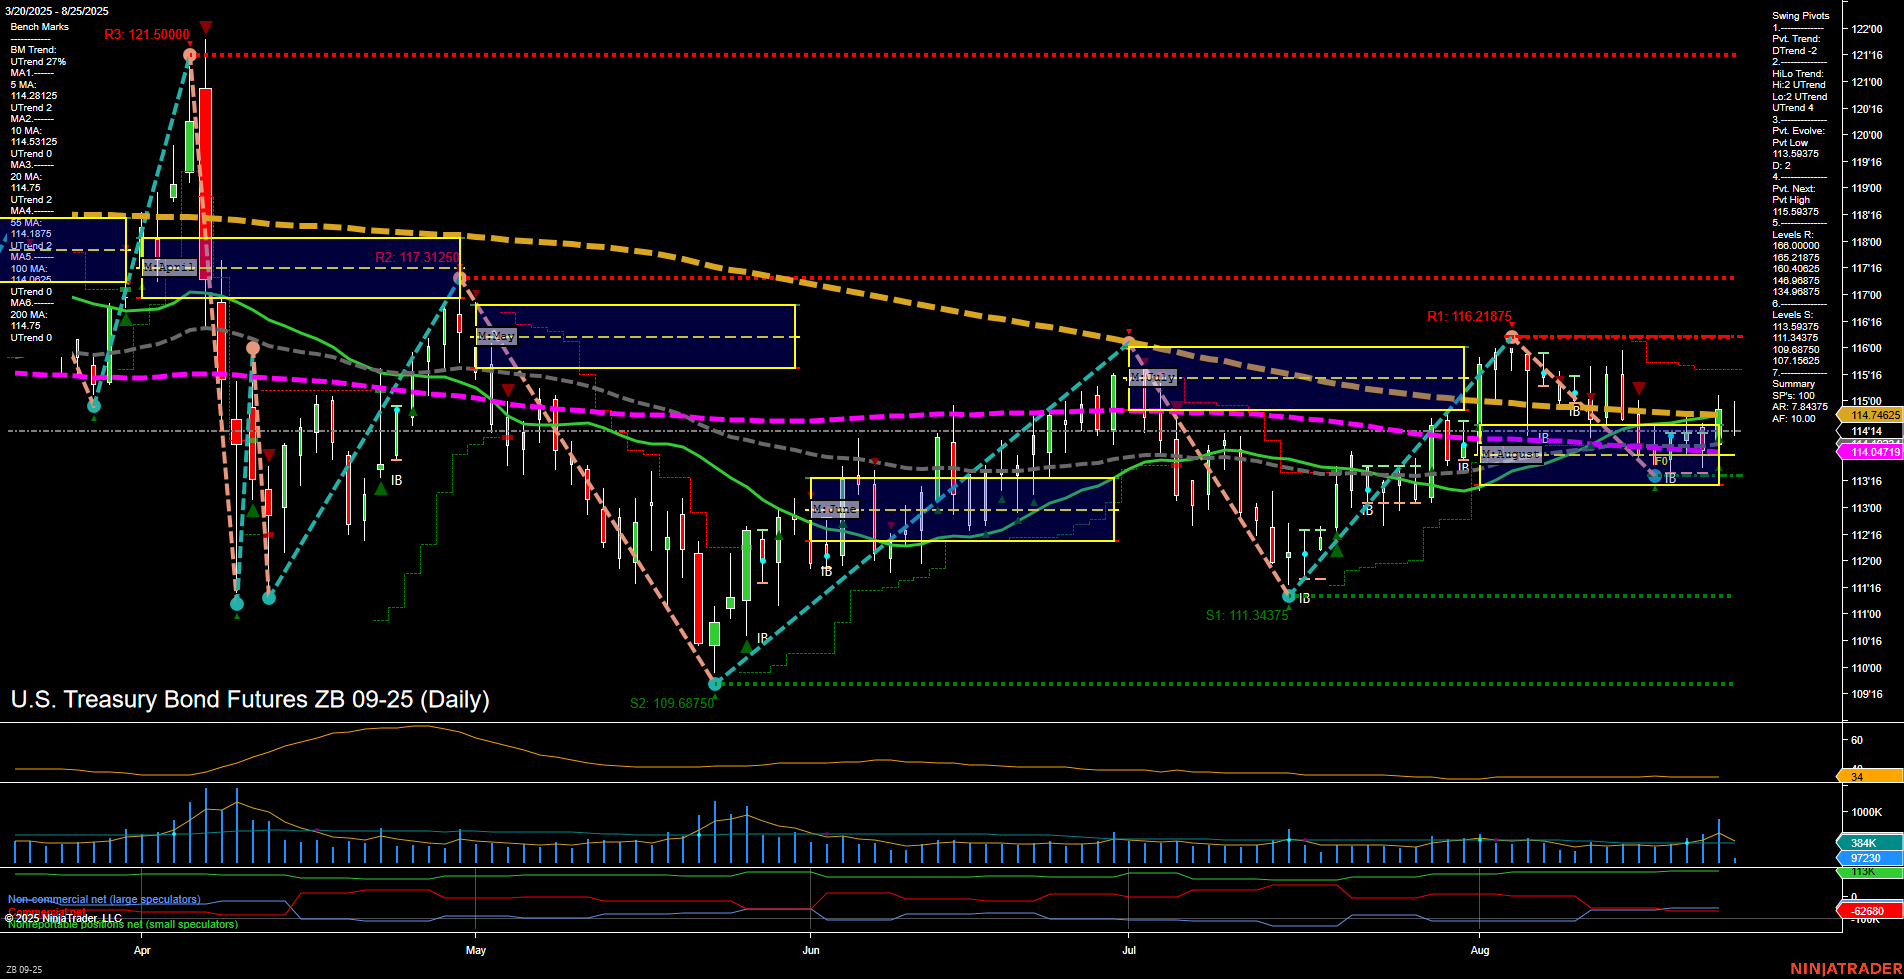
ZB U.S. Treasury Bond Futures Daily Chart Analysis: 2025-Aug-25 07:18 CT
Price Action
- Last: 114.14,
- Bars: Medium,
- Mom: Momentum slow.
WSFG Weekly
- Short-Term
- WSFG Current: NA%
- F0%/NTZ' Bias: Price Neutral,
- WSFG Trend: Neutral.
MSFG Month Aug
- Intermediate-Term
- MSFG Current: NA%
- F0%/NTZ' Bias: Price Neutral,
- MSFG Trend: Neutral.
YSFG Year 2025
- Long-Term
- YSFG Current: NA%
- F0%/NTZ' Bias: Price Neutral,
- YSFG Trend: Neutral.
Swing Pivots
- (Short-Term) 1. Pvt. Trend: DTrend,
- (Intermediate-Term) 2. HiLo Trend: UTrend,
- 3. Pvt. Evolve: Pvt Low 113.0375,
- 4. Pvt. Next: Pvt High 115.59375,
- 5. Levels R: 121.50000, 117.31250, 116.21875, 115.59375, 114.9875,
- 6. Levels S: 113.4375, 113.0375, 111.34375, 109.6875.
Daily Benchmarks
- (Short-Term) 5 Day: 114.28 Down Trend,
- (Short-Term) 10 Day: 114.21 Down Trend,
- (Intermediate-Term) 20 Day: 114.74 Down Trend,
- (Intermediate-Term) 55 Day: 114.05 Up Trend,
- (Long-Term) 100 Day: 114.04 Up Trend,
- (Long-Term) 200 Day: 114.71 Down Trend.
Additional Metrics
Overall Rating
- Short-Term: Neutral,
- Intermediate-Term: Neutral,
- Long-Term: Neutral.
Key Insights Summary
The ZB U.S. Treasury Bond Futures daily chart is currently characterized by a neutral stance across all timeframes. Price action is consolidating within a medium range, with slow momentum and no clear directional bias. The short-term swing pivot trend is down, but the intermediate-term HiLo trend remains up, reflecting a market caught between recent lower highs and higher lows. Key resistance levels are clustered above at 115.59 and 116.21, while support is found at 113.43 and 113.03, with a broader base at 111.34. Moving averages are mixed: short-term and major-trend (200-day) are in a downtrend, while intermediate and long-term (55/100-day) are slightly up, reinforcing the overall indecisive tone. ATR and volume metrics suggest moderate volatility and participation. No strong signals are present from the session fib grids, and the market appears to be in a holding pattern, likely awaiting a catalyst for breakout or breakdown. This environment is typical of late-summer trade, with participants possibly waiting for new macroeconomic data or policy signals before committing to a new trend.
Chart Analysis ATS AI Generated: 2025-08-25 07:19 for Informational use only, not trading advice. Terms and Risk Disclosure Copyright © 2025. Algo Trading Systems LLC.
