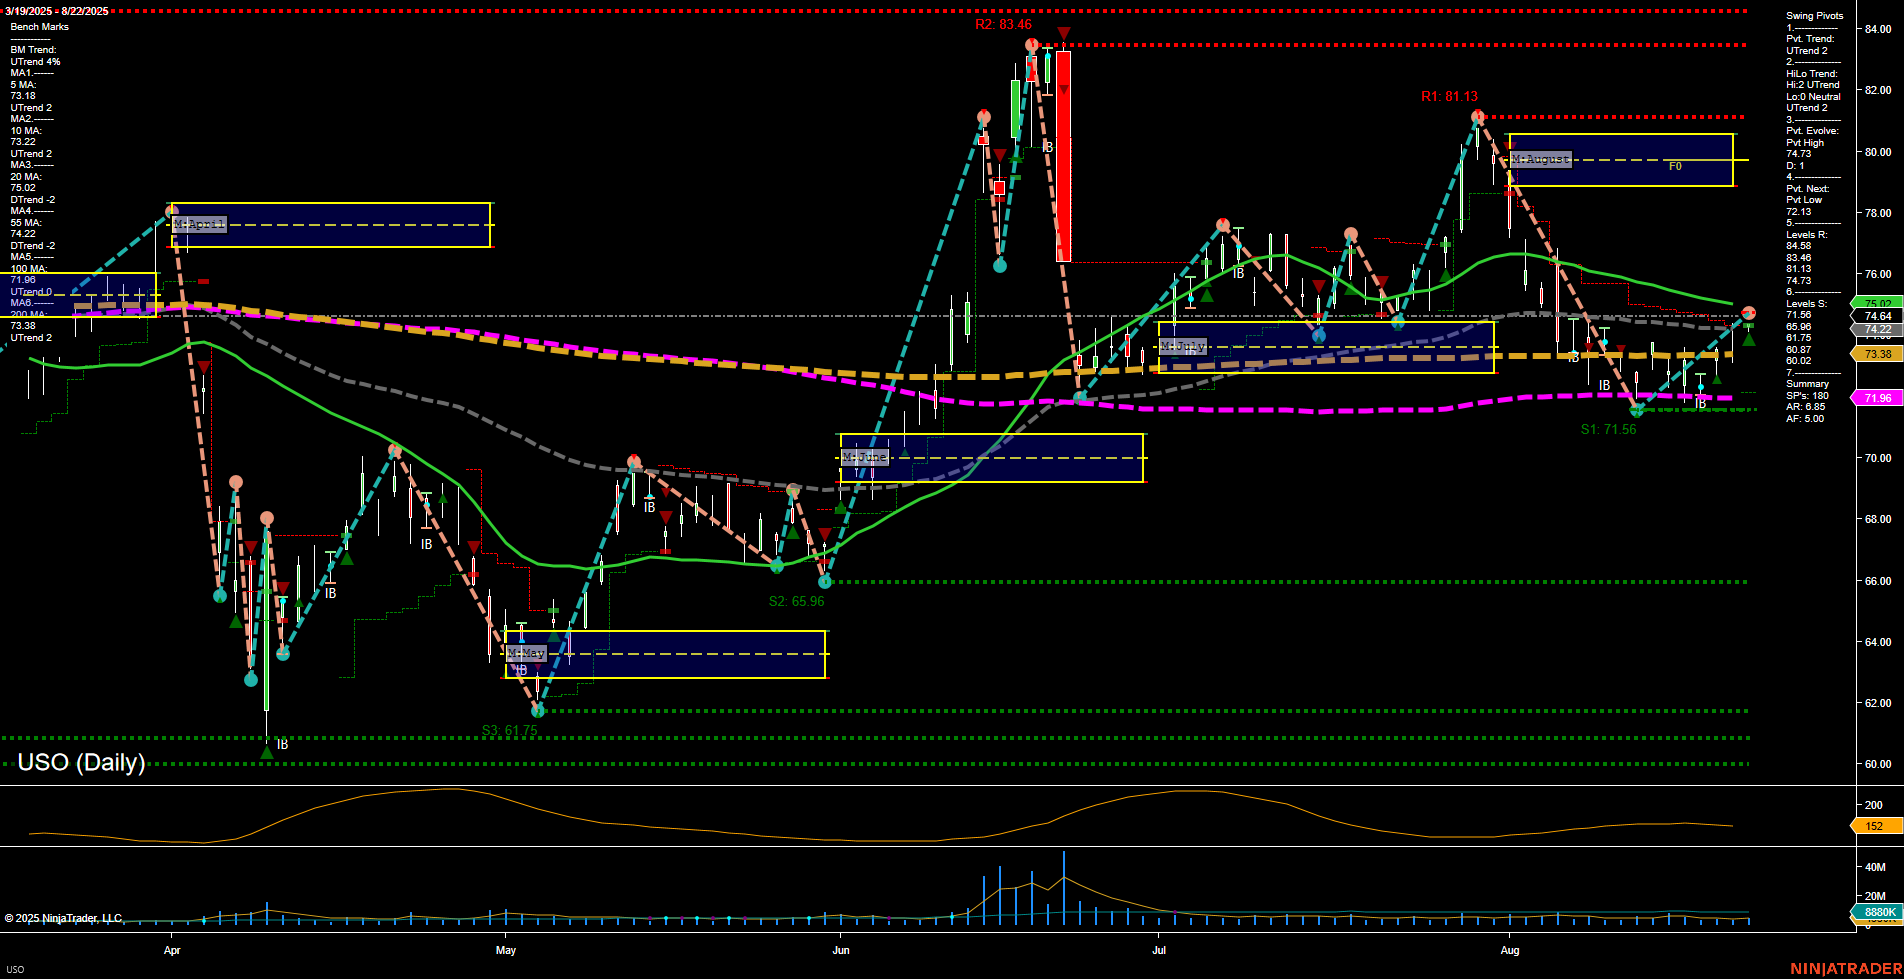
USO United States Oil Fund LP Daily Chart Analysis: 2025-Aug-25 07:17 CT
Price Action
- Last: 74.19,
- Bars: Medium,
- Mom: Momentum slow.
WSFG Weekly
- Short-Term
- WSFG Current: NA%
- F0%/NTZ' Bias: Price Neutral,
- WSFG Trend: Neutral.
MSFG Month Aug
- Intermediate-Term
- MSFG Current: NA%
- F0%/NTZ' Bias: Price Neutral,
- MSFG Trend: Neutral.
YSFG Year 2025
- Long-Term
- YSFG Current: NA%
- F0%/NTZ' Bias: Price Neutral,
- YSFG Trend: Neutral.
Swing Pivots
- (Short-Term) 1. Pvt. Trend: UTrend,
- (Intermediate-Term) 2. HiLo Trend: UTrend,
- 3. Pvt. Evolve: Pvt high 74.19,
- 4. Pvt. Next: Pvt low 71.96,
- 5. Levels R: 75.09, 74.64, 74.19,
- 6. Levels S: 73.38, 71.96.
Daily Benchmarks
- (Short-Term) 5 Day: 73.18 Up Trend,
- (Short-Term) 10 Day: 72.22 Up Trend,
- (Intermediate-Term) 20 Day: 74.62 Down Trend,
- (Intermediate-Term) 55 Day: 71.96 Up Trend,
- (Long-Term) 100 Day: 70.08 Up Trend,
- (Long-Term) 200 Day: 70.62 Up Trend.
Additional Metrics
- ATR: 138,
- VOLMA: 2,577,640.
Overall Rating
- Short-Term: Neutral,
- Intermediate-Term: Neutral,
- Long-Term: Bullish.
Key Insights Summary
USO is currently trading in a consolidation phase after a recent pullback, with price action showing medium-sized bars and slow momentum. The short-term and intermediate-term trends are neutral, as indicated by the WSFG and MSFG, with price hovering near key resistance levels (75.09, 74.64, 74.19) and support at 73.38 and 71.96. The swing pivot structure is in an uptrend for both short and intermediate terms, but the most recent pivot is a high, suggesting a potential for a short-term retracement or sideways movement. Moving averages show mixed signals: short-term MAs are trending up, but the 20-day MA is in a downtrend, indicating some near-term weakness within a broader bullish context. Long-term MAs remain in an uptrend, supporting a positive outlook for the longer horizon. Volatility (ATR) is moderate, and volume is steady. Overall, the chart reflects a market in transition, with no clear breakout or breakdown, and traders may be watching for a decisive move above resistance or a test of support to define the next directional swing.
Chart Analysis ATS AI Generated: 2025-08-25 07:17 for Informational use only, not trading advice. Terms and Risk Disclosure Copyright © 2025. Algo Trading Systems LLC.
