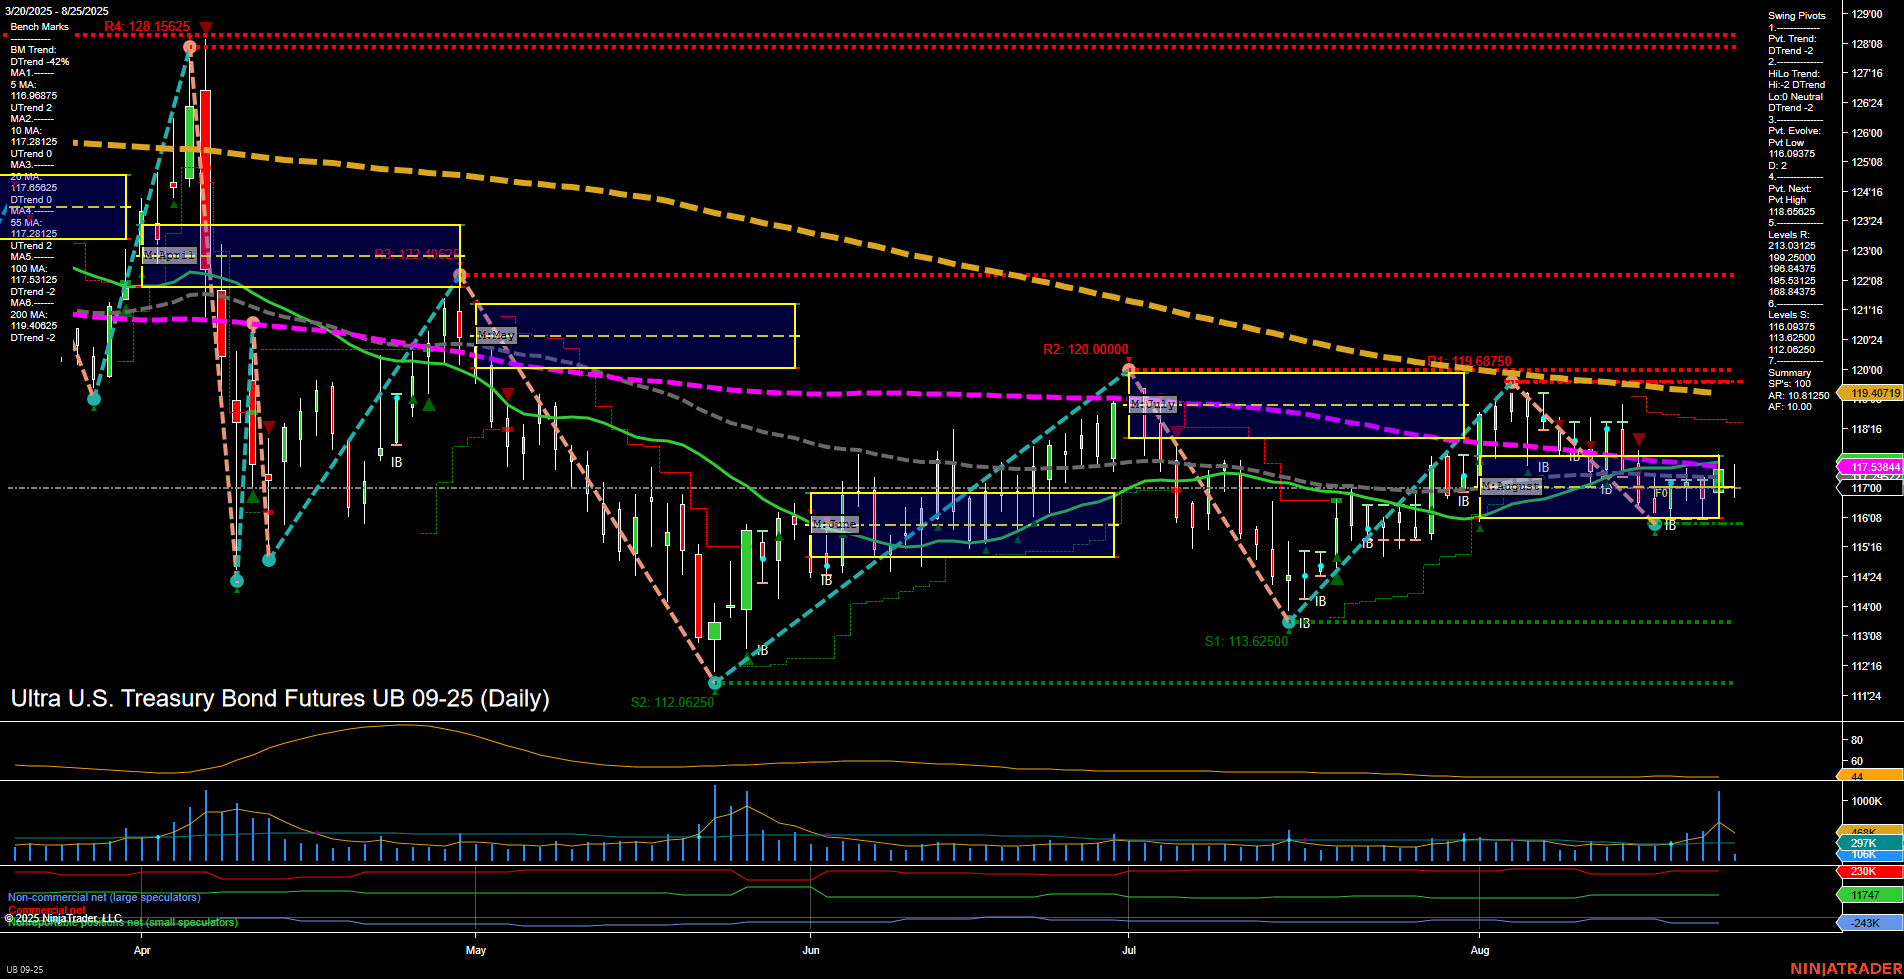
UB Ultra U.S. Treasury Bond Futures Daily Chart Analysis: 2025-Aug-25 07:16 CT
Price Action
- Last: 117.28125,
- Bars: Medium,
- Mom: Momentum slow.
WSFG Weekly
- Short-Term
- WSFG Current: -23%
- F0%/NTZ' Bias: Price Below,
- WSFG Trend: Down.
MSFG Month Aug
- Intermediate-Term
- MSFG Current: 1%
- F0%/NTZ' Bias: Price Above,
- MSFG Trend: Up.
YSFG Year 2025
- Long-Term
- YSFG Current: -3%
- F0%/NTZ' Bias: Price Below,
- YSFG Trend: Down.
Swing Pivots
- (Short-Term) 1. Pvt. Trend: DTrend,
- (Intermediate-Term) 2. HiLo Trend: DTrend,
- 3. Pvt. Evolve: Pvt High 119.6875,
- 4. Pvt. Next: Pvt Low 116.09375,
- 5. Levels R: 128.15625, 126.40625, 124.28125, 120.00000, 119.6875, 118.53125, 118.09375,
- 6. Levels S: 113.625, 112.0625.
Daily Benchmarks
- (Short-Term) 5 Day: 116.86875 Down Trend,
- (Short-Term) 10 Day: 117.28125 Down Trend,
- (Intermediate-Term) 20 Day: 117.53844 Down Trend,
- (Intermediate-Term) 55 Day: 117.58125 Down Trend,
- (Long-Term) 100 Day: 118.28125 Down Trend,
- (Long-Term) 200 Day: 119.40719 Down Trend.
Additional Metrics
Recent Trade Signals
- 22 Aug 2025: Long UB 09-25 @ 117.5 Signals.USAR-MSFG
- 22 Aug 2025: Long UB 09-25 @ 117.125 Signals.USAR-WSFG
- 21 Aug 2025: Short UB 09-25 @ 116.40625 Signals.USAR.TR120
- 18 Aug 2025: Short UB 09-25 @ 116.25 Signals.USAR.TR720
Overall Rating
- Short-Term: Bearish,
- Intermediate-Term: Neutral,
- Long-Term: Bearish.
Key Insights Summary
The UB Ultra U.S. Treasury Bond Futures daily chart reflects a market in a corrective phase, with short-term and long-term trends both pointing down, as confirmed by the swing pivot trends and all benchmark moving averages trending lower. Price is currently consolidating just above the monthly session fib grid (MSFG) center, suggesting some intermediate-term support, but the overall structure remains heavy with resistance levels stacked above. Recent trade signals show mixed activity, with both long and short entries in the past week, highlighting a choppy environment. Volatility is moderate, and volume has picked up, indicating active participation but no clear directional conviction. The market is likely in a retracement or consolidation phase within a broader downtrend, with lower highs and support tests dominating the technical landscape.
Chart Analysis ATS AI Generated: 2025-08-25 07:17 for Informational use only, not trading advice. Terms and Risk Disclosure Copyright © 2025. Algo Trading Systems LLC.
