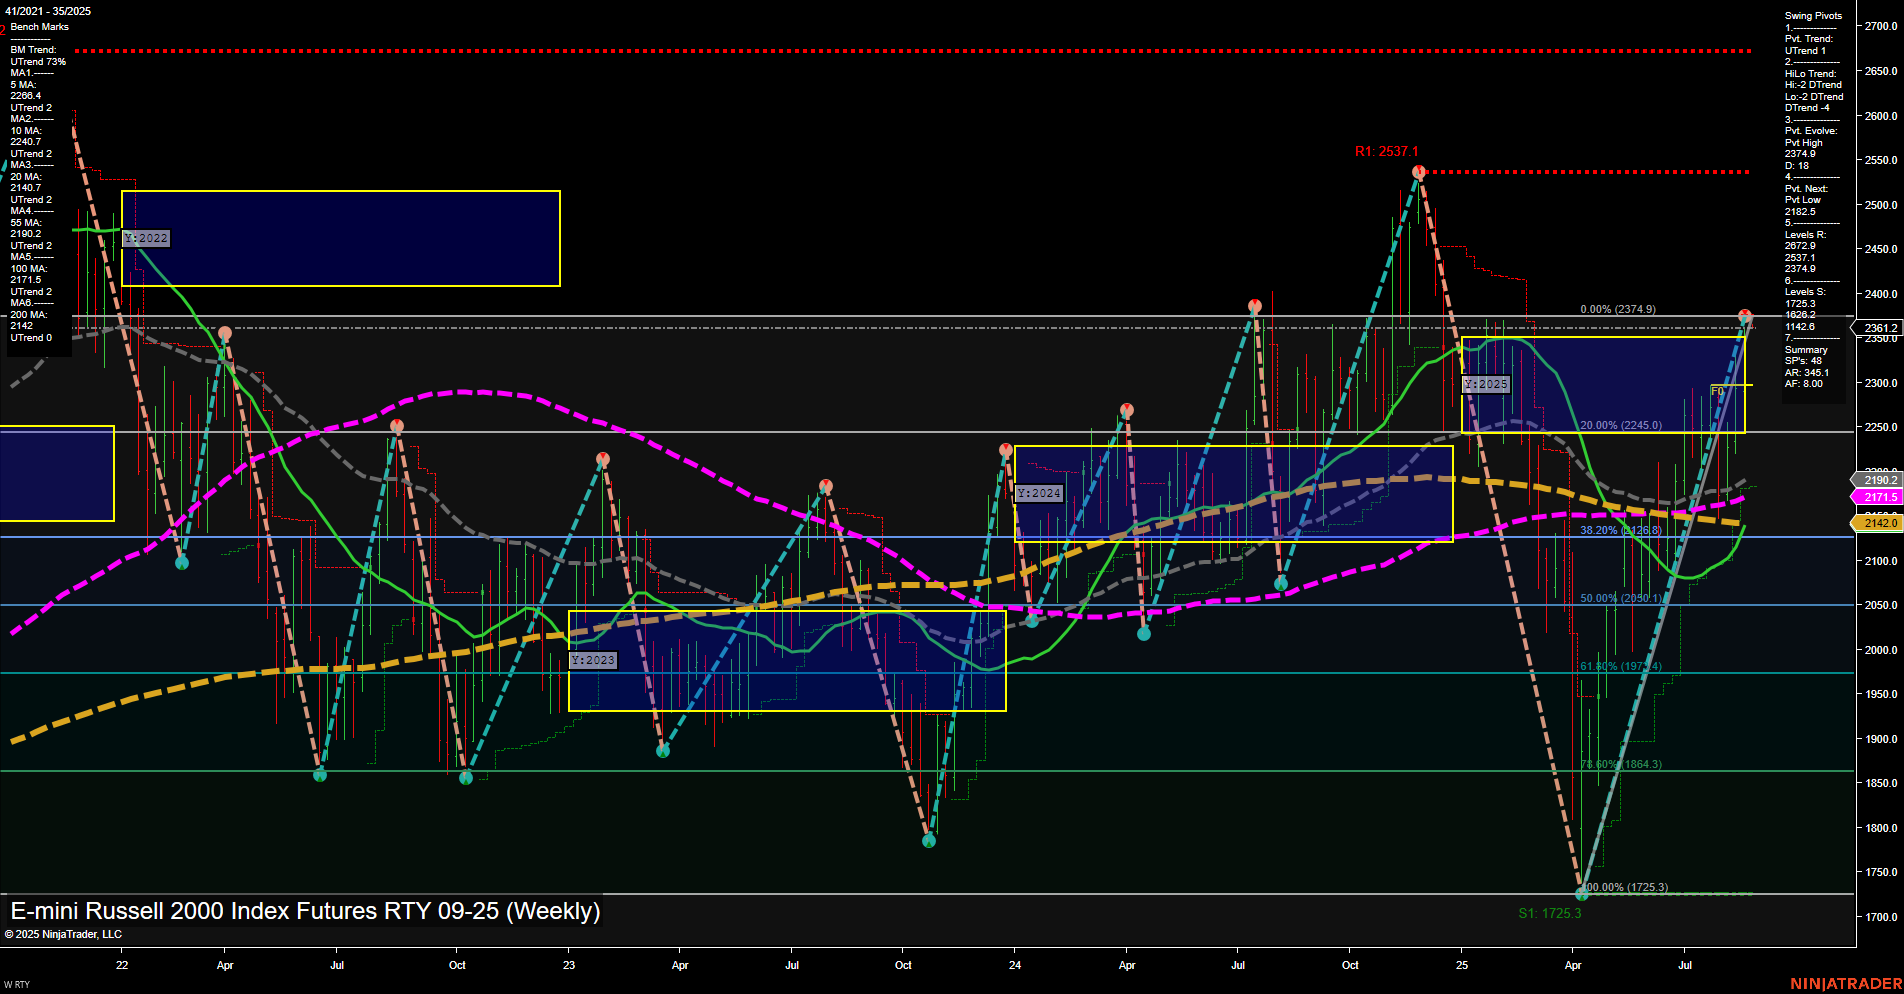
RTY E-mini Russell 2000 Index Futures Weekly Chart Analysis: 2025-Aug-25 07:14 CT
Price Action
- Last: 2291.2,
- Bars: Large,
- Mom: Momentum fast.
WSFG Weekly
- Short-Term
- WSFG Current: -4%
- F0%/NTZ' Bias: Price Below,
- WSFG Trend: Down.
MSFG Month Aug
- Intermediate-Term
- MSFG Current: 113%
- F0%/NTZ' Bias: Price Above,
- MSFG Trend: Up.
YSFG Year 2025
- Long-Term
- YSFG Current: 12%
- F0%/NTZ' Bias: Price Above,
- YSFG Trend: Up.
Swing Pivots
- (Short-Term) 1. Pvt. Trend: UTrend,
- (Intermediate-Term) 2. HiLo Trend: DTrend,
- 3. Pvt. Evolve: Pvt high 2374.9,
- 4. Pvt. Next: Pvt low 2128.5,
- 5. Levels R: 2537.1, 2374.9,
- 6. Levels S: 1725.3.
Weekly Benchmarks
- (Intermediate-Term) 5 Week: 2264 Up Trend,
- (Intermediate-Term) 10 Week: 2172 Up Trend,
- (Long-Term) 20 Week: 2147 Up Trend,
- (Long-Term) 55 Week: 2119 Down Trend,
- (Long-Term) 100 Week: 2171.5 Up Trend,
- (Long-Term) 200 Week: 2142 Down Trend.
Recent Trade Signals
- 22 Aug 2025: Long RTY 09-25 @ 2291.2 Signals.USAR.TR120
- 21 Aug 2025: Short RTY 09-25 @ 2271.4 Signals.USAR-WSFG
Overall Rating
- Short-Term: Bullish,
- Intermediate-Term: Neutral,
- Long-Term: Bullish.
Key Insights Summary
The RTY weekly chart shows a strong recent rally with large, fast momentum bars pushing price above key intermediate and long-term moving averages. The short-term swing pivot trend is up, supported by a recent long signal, but the weekly session fib grid (WSFG) trend remains down, indicating some short-term resistance and potential for volatility. Intermediate-term signals are mixed: the monthly fib grid (MSFG) is strongly up, but the HiLo trend is down, suggesting a possible retracement or consolidation phase after the recent surge. Long-term structure is constructive, with price above yearly fib grid levels and most long-term moving averages trending up, except for the 55 and 200 week which are lagging. Key resistance sits at 2374.9 and 2537.1, with major support at 1725.3. The market is in a transition phase, with bullish momentum in the short and long term, but some intermediate-term caution as the market digests recent gains and tests overhead resistance. The environment is characterized by strong moves, potential for pullbacks, and a focus on whether the rally can sustain above the NTZ and key swing highs.
Chart Analysis ATS AI Generated: 2025-08-25 07:14 for Informational use only, not trading advice. Terms and Risk Disclosure Copyright © 2025. Algo Trading Systems LLC.
