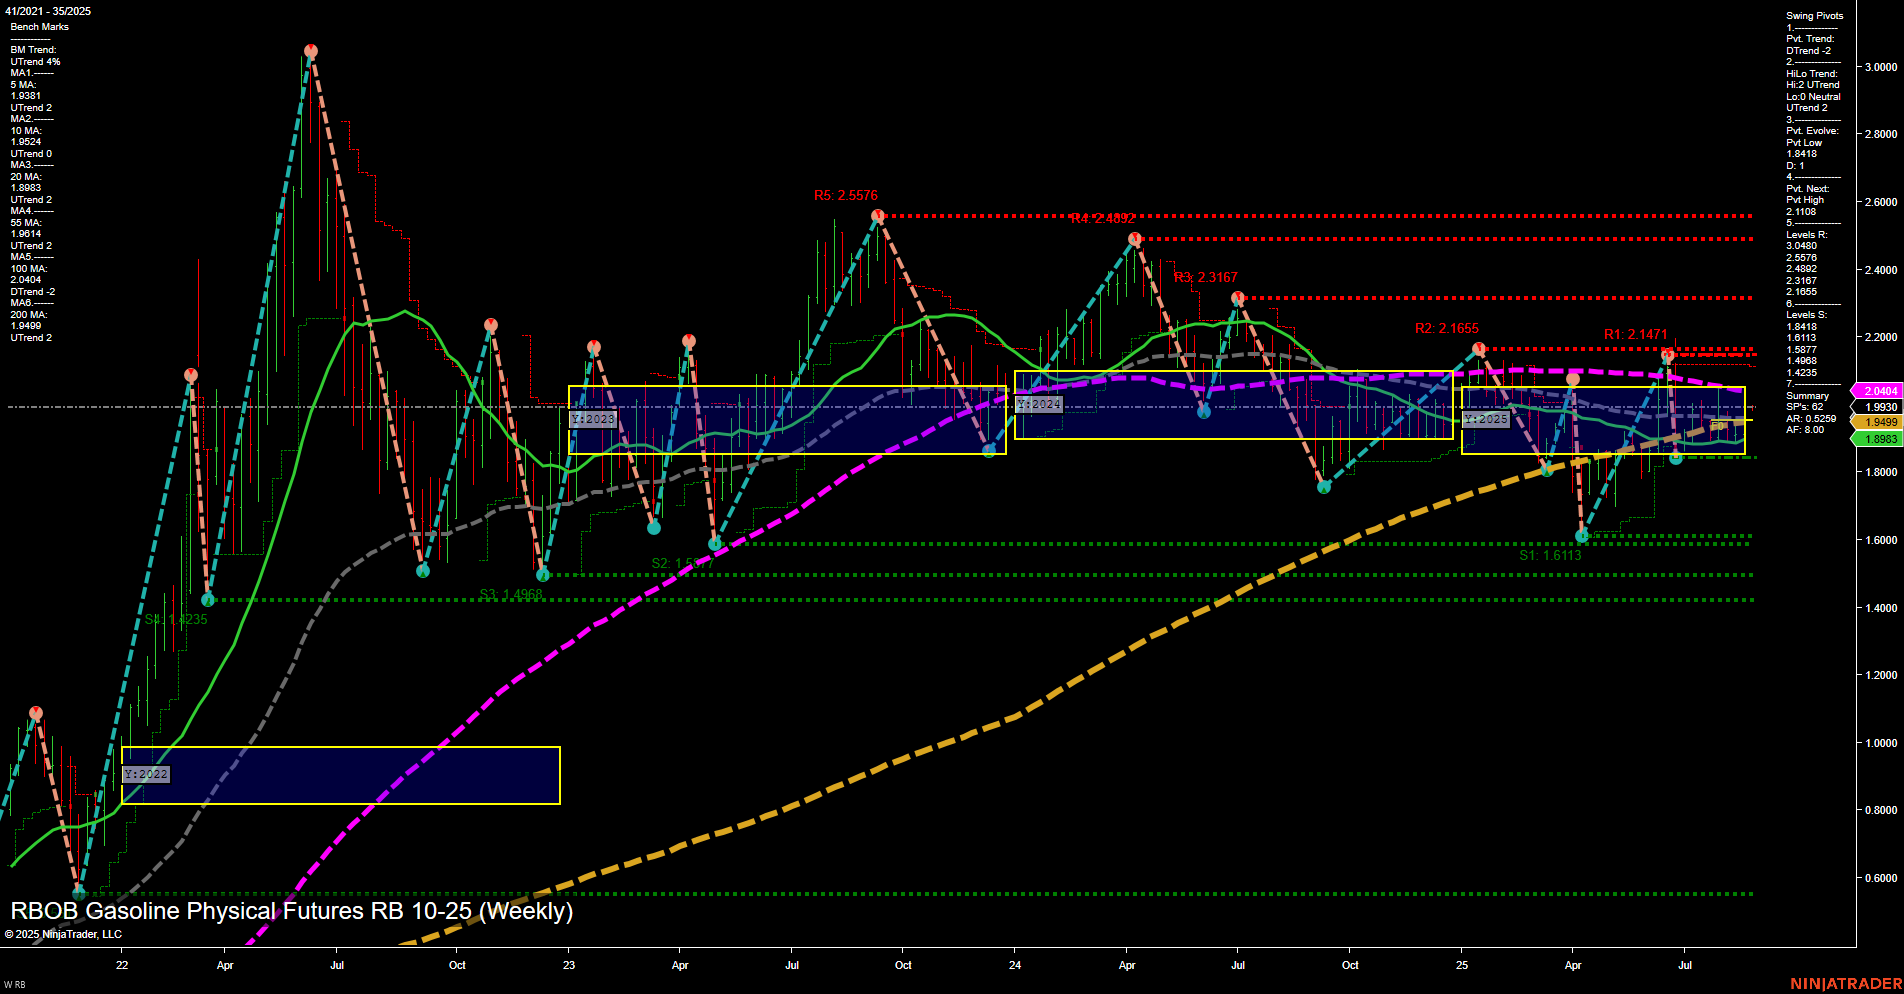
The weekly chart for RBOB Gasoline Futures (RB 10-25) shows a market in transition. Price action is currently subdued with medium-sized bars and slow momentum, reflecting a lack of strong directional conviction. Short-term and intermediate-term trends are both down, as indicated by the WSFG and MSFG, with price trading below their respective NTZ/F0% levels. However, the yearly trend remains up, with price still above the long-term NTZ/F0% and the YSFG showing a positive reading. Swing pivots highlight a short-term downtrend, but the intermediate-term HiLo trend is up, suggesting some underlying support or a potential for reversal if momentum shifts. Key resistance levels are clustered above 2.10, while strong support is seen near 1.61 and 1.49. The moving averages are mixed: short and intermediate-term MAs are trending down, but the 55 and 200-week MAs are still in uptrends, indicating a broader consolidation phase. Recent trade signals show a long entry, but the overall technical structure suggests the market is caught between bearish short-term pressure and longer-term support. The environment is characterized by choppy, range-bound action with no clear breakout or breakdown, and the market is likely waiting for a catalyst to resolve this consolidation. Swing traders should note the potential for both support tests and resistance rejections in the coming weeks.