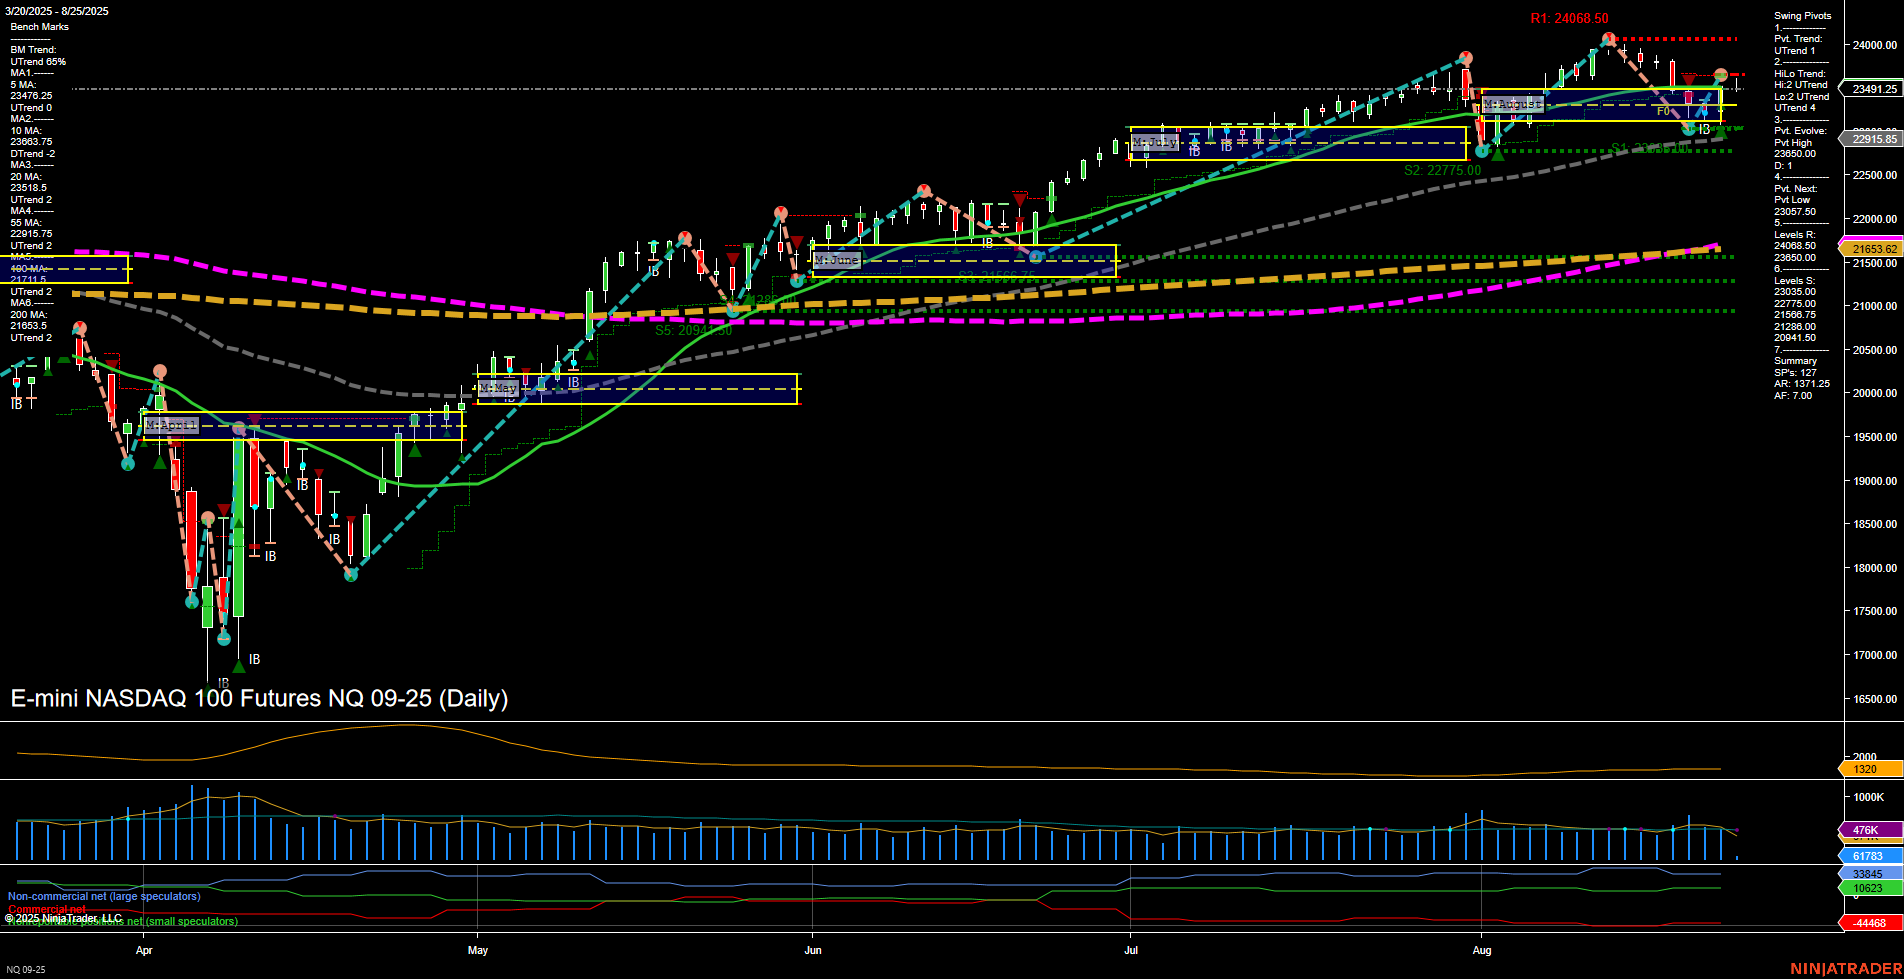
NQ E-mini NASDAQ 100 Futures Daily Chart Analysis: 2025-Aug-25 07:12 CT
Price Action
- Last: 23,491.25,
- Bars: Medium,
- Mom: Average.
WSFG Weekly
- Short-Term
- WSFG Current: -12%
- F0%/NTZ' Bias: Price Below,
- WSFG Trend: Down.
MSFG Month Aug
- Intermediate-Term
- MSFG Current: 13%
- F0%/NTZ' Bias: Price Above,
- MSFG Trend: Up.
YSFG Year 2025
- Long-Term
- YSFG Current: 38%
- F0%/NTZ' Bias: Price Above,
- YSFG Trend: Up.
Swing Pivots
- (Short-Term) 1. Pvt. Trend: UTrend,
- (Intermediate-Term) 2. HiLo Trend: UTrend,
- 3. Pvt. Evolve: Pvt High 23,900,
- 4. Pvt. Next: Pvt Low 21,563.62,
- 5. Levels R: 24,068.50, 23,057.50, 23,606.00,
- 6. Levels S: 22,775.00, 21,880.00, 21,563.62, 20,941.50.
Daily Benchmarks
- (Short-Term) 5 Day: 23,478.25 Up Trend,
- (Short-Term) 10 Day: 23,060.75 Up Trend,
- (Intermediate-Term) 20 Day: 22,518.75 Up Trend,
- (Intermediate-Term) 55 Day: 21,663.25 Up Trend,
- (Long-Term) 100 Day: 21,053.25 Up Trend,
- (Long-Term) 200 Day: 20,004.25 Up Trend.
Additional Metrics
- ATR: 1618,
- VOLMA: 626746.
Recent Trade Signals
- 25 Aug 2025: Long NQ 09-25 @ 23,565.5 Signals.USAR-MSFG
- 22 Aug 2025: Long NQ 09-25 @ 23,606.25 Signals.USAR.TR120
- 20 Aug 2025: Short NQ 09-25 @ 23,344.5 Signals.USAR.TR720
- 19 Aug 2025: Short NQ 09-25 @ 23,678.25 Signals.USAR-WSFG
Overall Rating
- Short-Term: Neutral,
- Intermediate-Term: Bullish,
- Long-Term: Bullish.
Key Insights Summary
The NQ E-mini NASDAQ 100 Futures daily chart shows a market in a broad uptrend on both intermediate and long-term timeframes, as indicated by the MSFG and YSFG trends, as well as all major moving averages pointing upward. The short-term picture is more mixed: while the swing pivot trend remains up and recent trade signals have shifted back to long, the weekly session fib grid (WSFG) is in a downtrend with price below its NTZ, suggesting some short-term weakness or consolidation. Resistance is clustered near recent highs (24,068.50), while support is layered below at 22,775.00 and 21,563.62, providing clear reference points for potential pullbacks or bounces. Volatility (ATR) and volume metrics are moderate, indicating a healthy but not extreme trading environment. Overall, the market is in a bullish phase on higher timeframes, with short-term action showing some indecision or digestion after a strong rally, typical of late summer seasonality and post-earnings consolidation. The structure favors trend continuation on pullbacks, but short-term traders should be alert to potential choppy or range-bound conditions until a decisive breakout or breakdown occurs.
Chart Analysis ATS AI Generated: 2025-08-25 07:12 for Informational use only, not trading advice. Terms and Risk Disclosure Copyright © 2025. Algo Trading Systems LLC.
