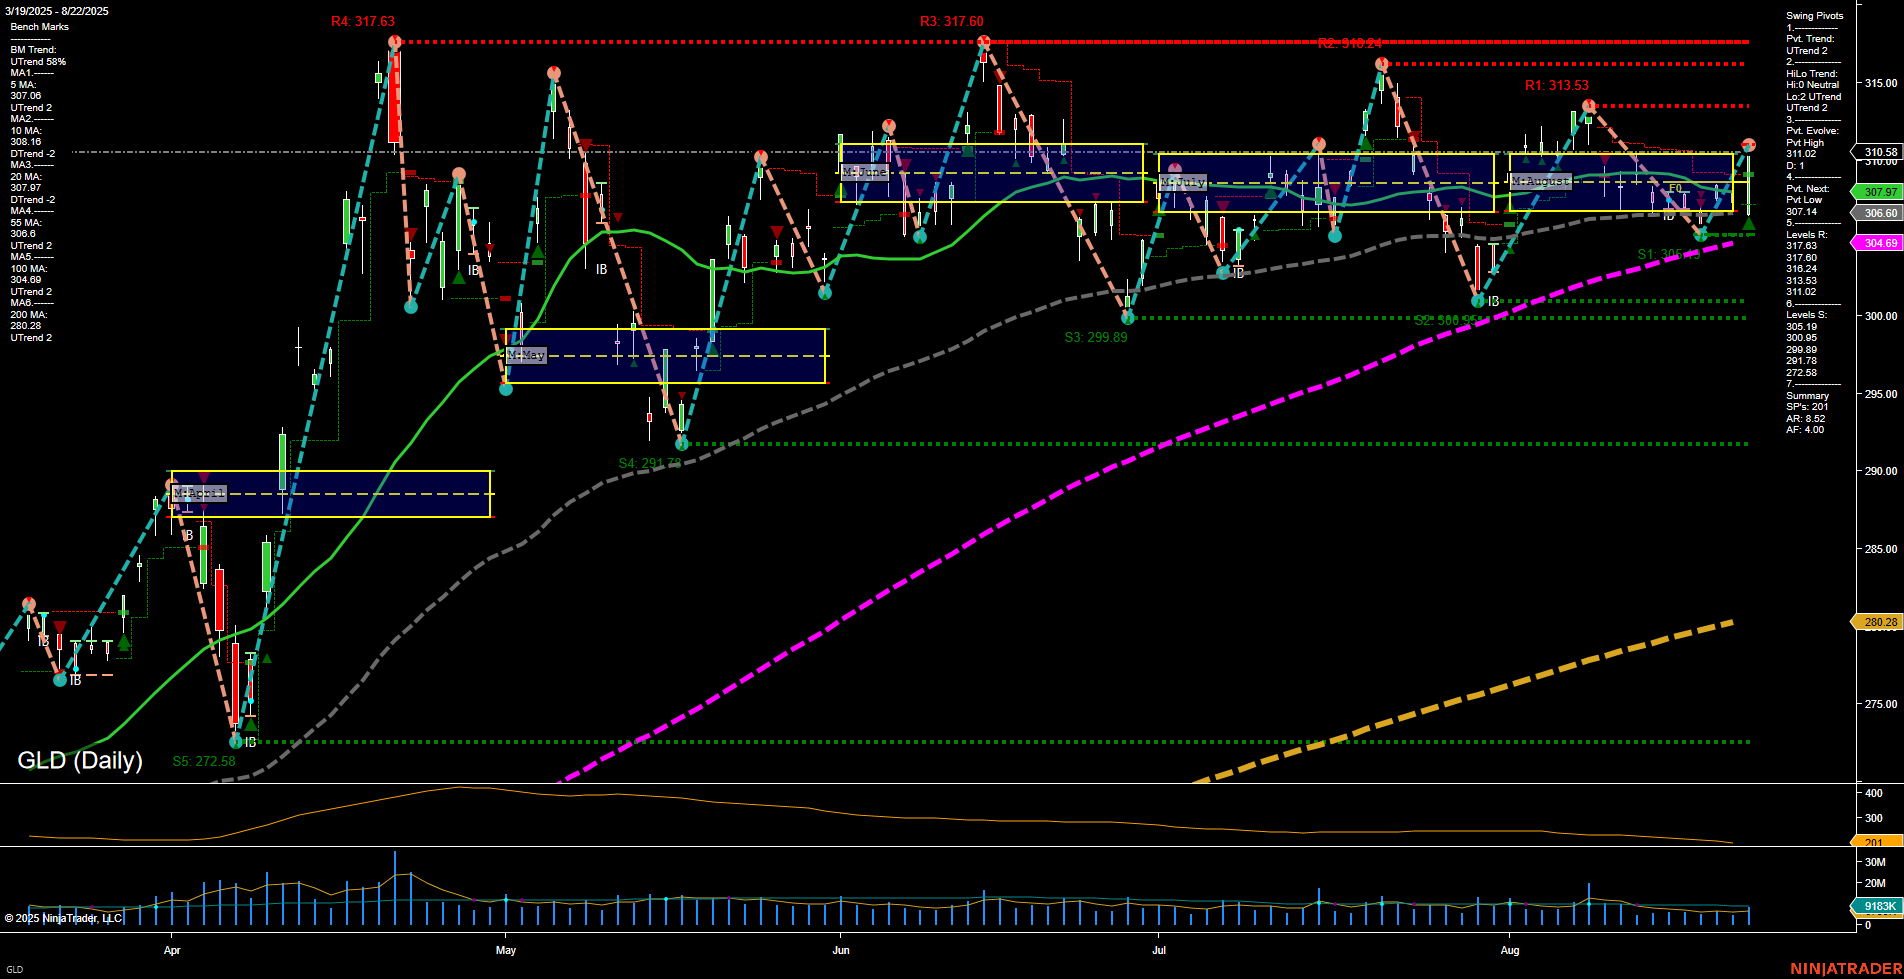
GLD SPDR Gold Shares Daily Chart Analysis: 2025-Aug-25 07:10 CT
Price Action
- Last: 307.14,
- Bars: Medium,
- Mom: Momentum average.
WSFG Weekly
- Short-Term
- WSFG Current: NA%
- F0%/NTZ' Bias: Price Neutral,
- WSFG Trend: Neutral.
MSFG Month Aug
- Intermediate-Term
- MSFG Current: NA%
- F0%/NTZ' Bias: Price Neutral,
- MSFG Trend: Neutral.
YSFG Year 2025
- Long-Term
- YSFG Current: NA%
- F0%/NTZ' Bias: Price Neutral,
- YSFG Trend: Neutral.
Swing Pivots
- (Short-Term) 1. Pvt. Trend: UTrend,
- (Intermediate-Term) 2. HiLo Trend: UTrend,
- 3. Pvt. Evolve: Pvt high 310.58,
- 4. Pvt. Next: Pvt low 307.97,
- 5. Levels R: 317.63, 317.60, 316.24, 313.53, 310.58,
- 6. Levels S: 307.97, 306.60, 304.69, 300.85, 299.89, 291.78, 272.58.
Daily Benchmarks
- (Short-Term) 5 Day: 307.00 Up Trend,
- (Short-Term) 10 Day: 306.14 Up Trend,
- (Intermediate-Term) 20 Day: 308.16 Down Trend,
- (Intermediate-Term) 55 Day: 304.69 Up Trend,
- (Long-Term) 100 Day: 299.42 Up Trend,
- (Long-Term) 200 Day: 280.28 Up Trend.
Additional Metrics
- ATR: 159,
- VOLMA: 7207880.
Overall Rating
- Short-Term: Neutral,
- Intermediate-Term: Neutral,
- Long-Term: Bullish.
Key Insights Summary
GLD is currently trading in a consolidation phase, with price action showing medium-sized bars and average momentum. The short-term and intermediate-term trends, as indicated by both the WSFG and MSFG, are neutral, reflecting a lack of clear directional bias. Swing pivots show an uptrend in both short-term and intermediate-term, but the most recent pivot evolution is a swing high, with the next potential pivot being a swing low at 307.97, suggesting a possible test of support. Resistance levels are clustered above 310, while support is layered below, with significant levels at 307.97 and 306.60. Moving averages indicate mixed signals: short-term and long-term MAs are in uptrends, but the 20-day MA is in a downtrend, highlighting some near-term weakness within a broader bullish structure. ATR and volume metrics suggest moderate volatility and participation. Overall, the market is in a holding pattern, with no strong breakout or breakdown, and is likely awaiting a catalyst for the next directional move. The long-term structure remains constructive, but short-term and intermediate-term traders may see more range-bound or choppy conditions until a decisive move occurs.
Chart Analysis ATS AI Generated: 2025-08-25 07:10 for Informational use only, not trading advice. Terms and Risk Disclosure Copyright © 2025. Algo Trading Systems LLC.
