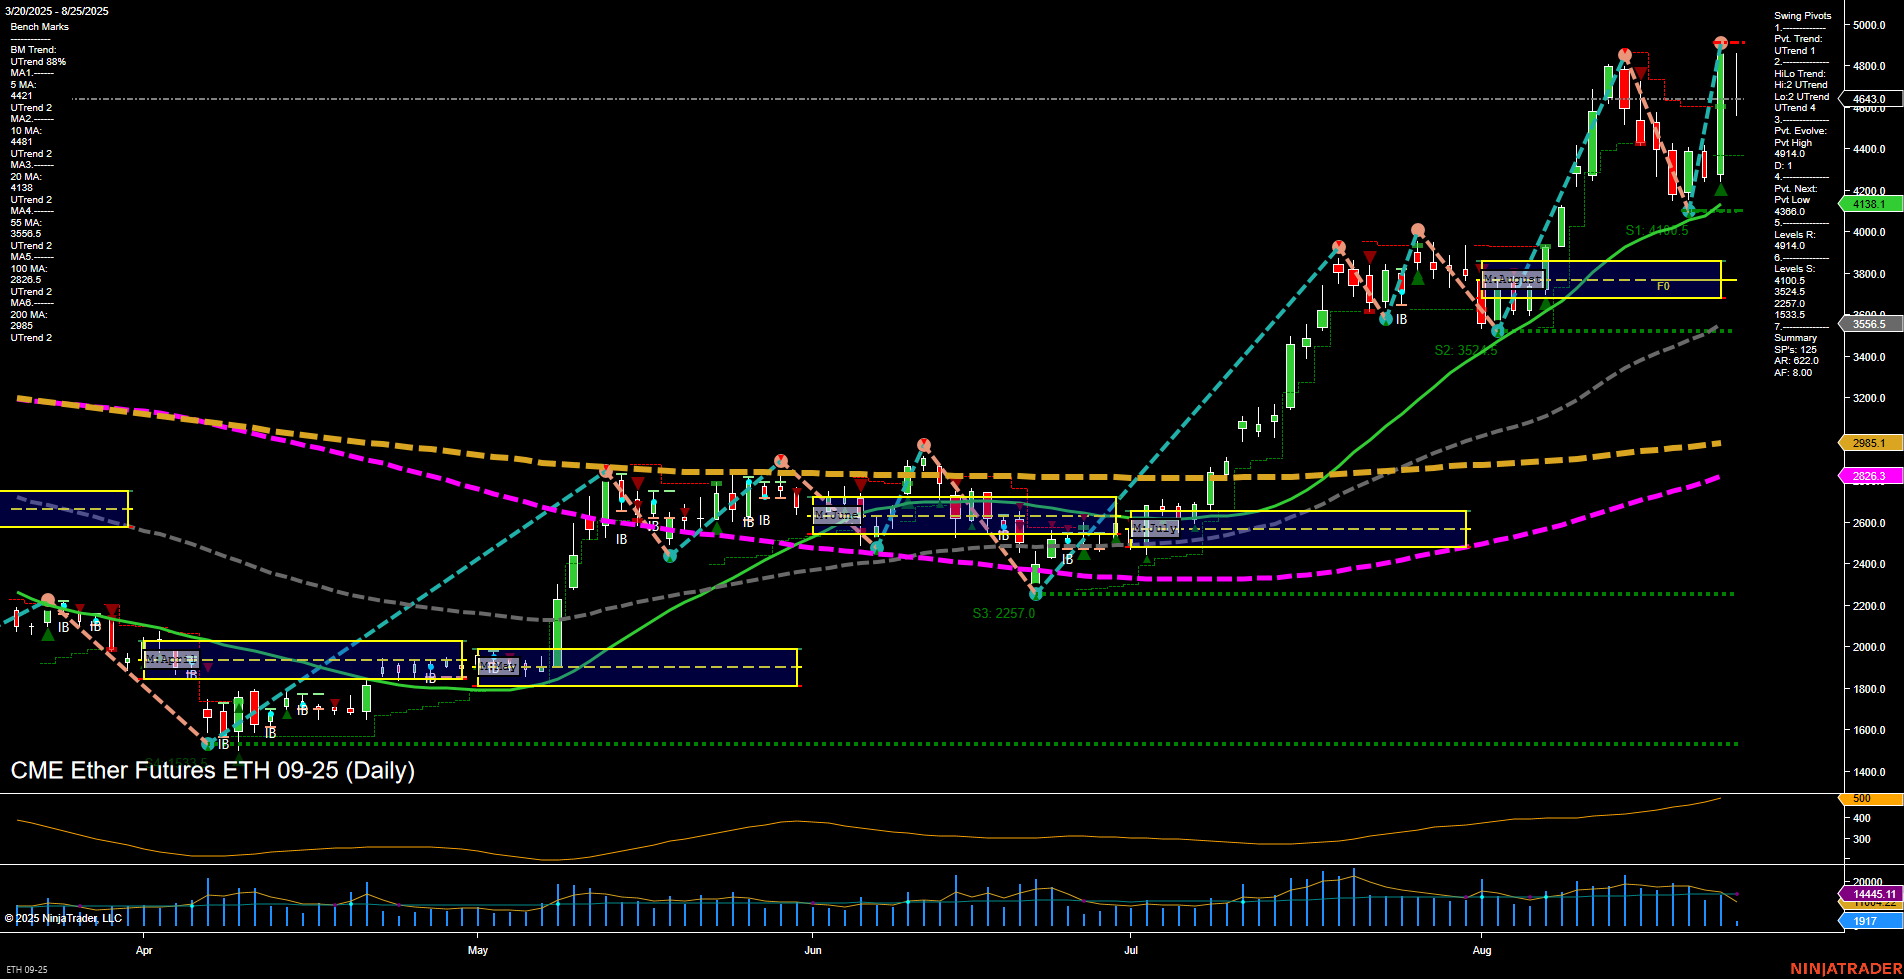
ETH CME Ether Futures Daily Chart Analysis: 2025-Aug-25 07:07 CT
Price Action
- Last: 4138.1,
- Bars: Large,
- Mom: Fast.
WSFG Weekly
- Short-Term
- WSFG Current: -35%
- F0%/NTZ' Bias: Price Below,
- WSFG Trend: Down.
MSFG Month Aug
- Intermediate-Term
- MSFG Current: 104%
- F0%/NTZ' Bias: Price Above,
- MSFG Trend: Up.
YSFG Year 2025
- Long-Term
- YSFG Current: 46%
- F0%/NTZ' Bias: Price Above,
- YSFG Trend: Up.
Swing Pivots
- (Short-Term) 1. Pvt. Trend: UTrend,
- (Intermediate-Term) 2. HiLo Trend: UTrend,
- 3. Pvt. Evolve: Pvt High 4643.0,
- 4. Pvt. Next: Pvt Low 4014.0,
- 5. Levels R: 4643.0, 4014.0,
- 6. Levels S: 4014.0, 3524.5, 2257.0.
Daily Benchmarks
- (Short-Term) 5 Day: 4421 Up Trend,
- (Short-Term) 10 Day: 4184 Up Trend,
- (Intermediate-Term) 20 Day: 4138 Up Trend,
- (Intermediate-Term) 55 Day: 3565.8 Up Trend,
- (Long-Term) 100 Day: 2826.9 Up Trend,
- (Long-Term) 200 Day: 2985.1 Up Trend.
Additional Metrics
Recent Trade Signals
- 20 Aug 2025: Long ETH 08-25 @ 4357 Signals.USAR.TR120
- 19 Aug 2025: Short ETH 08-25 @ 4195.5 Signals.USAR.TR720
- 18 Aug 2025: Short ETH 08-25 @ 4407.5 Signals.USAR-WSFG
Overall Rating
- Short-Term: Bullish,
- Intermediate-Term: Bullish,
- Long-Term: Bullish.
Key Insights Summary
The ETH CME Ether Futures daily chart shows strong bullish momentum, with large price bars and fast movement, indicating heightened volatility and active participation. The short-term swing pivot trend and intermediate-term HiLo trend are both in uptrends, supported by a series of higher highs and higher lows. All benchmark moving averages across short, intermediate, and long-term timeframes are trending upward, confirming broad-based strength. The price is currently above both the monthly and yearly session fib grid centers, reinforcing the intermediate and long-term bullish bias, though the weekly grid shows a short-term pullback with price below the weekly NTZ. Recent trade signals reflect both long and short entries, highlighting active swing trading opportunities in a volatile environment. The ATR and volume metrics confirm elevated volatility and liquidity. Overall, the chart structure suggests a strong uptrend with potential for further upside, though short-term pullbacks and rapid reversals remain possible within the broader bullish context.
Chart Analysis ATS AI Generated: 2025-08-25 07:07 for Informational use only, not trading advice. Terms and Risk Disclosure Copyright © 2025. Algo Trading Systems LLC.
