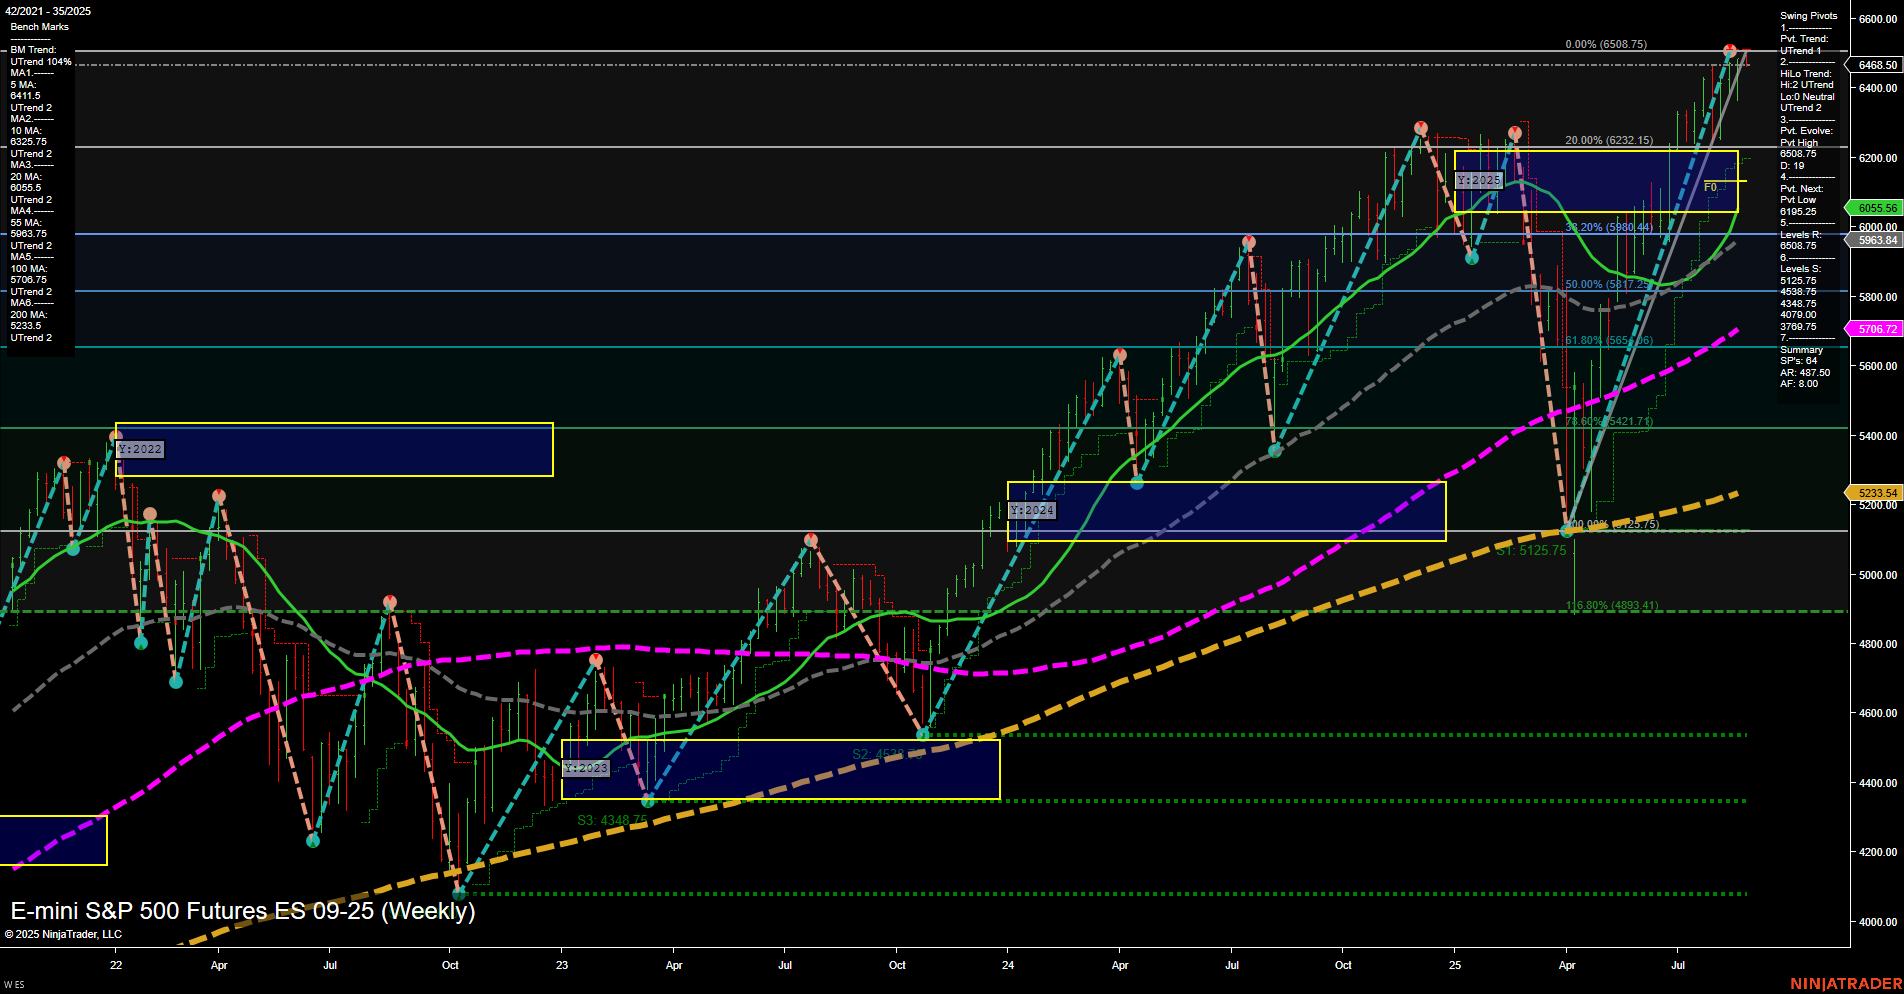
ES E-mini S&P 500 Futures Weekly Chart Analysis: 2025-Aug-25 07:06 CT
Price Action
- Last: 6486.50,
- Bars: Large,
- Mom: Momentum fast.
WSFG Weekly
- Short-Term
- WSFG Current: -15%
- F0%/NTZ' Bias: Price Below,
- WSFG Trend: Down.
MSFG Month Aug
- Intermediate-Term
- MSFG Current: 35%
- F0%/NTZ' Bias: Price Above,
- MSFG Trend: Up.
YSFG Year 2025
- Long-Term
- YSFG Current: 38%
- F0%/NTZ' Bias: Price Above,
- YSFG Trend: Up.
Swing Pivots
- (Short-Term) 1. Pvt. Trend: UTrend,
- (Intermediate-Term) 2. HiLo Trend: UTrend,
- 3. Pvt. Evolve: Pvt high 6508.75,
- 4. Pvt. Next: Pvt low 6005.75,
- 5. Levels R: 6508.75, 6323.15, 6192.25,
- 6. Levels S: 6005.75, 5760.72, 5233.54.
Weekly Benchmarks
- (Intermediate-Term) 5 Week: 6411.14 Up Trend,
- (Intermediate-Term) 10 Week: 6326.75 Up Trend,
- (Long-Term) 20 Week: 6055.15 Up Trend,
- (Long-Term) 55 Week: 5760.72 Up Trend,
- (Long-Term) 100 Week: 5709.74 Up Trend,
- (Long-Term) 200 Week: 5233.54 Up Trend.
Recent Trade Signals
- 22 Aug 2025: Long ES 09-25 @ 6489 Signals.USAR-WSFG
- 22 Aug 2025: Long ES 09-25 @ 6489 Signals.USAR.TR120
Overall Rating
- Short-Term: Neutral,
- Intermediate-Term: Bullish,
- Long-Term: Bullish.
Key Insights Summary
The ES E-mini S&P 500 Futures weekly chart shows a market in a strong uptrend on both intermediate and long-term timeframes, with all major moving averages trending higher and price well above key benchmarks. The most recent swing pivot is a new high at 6508.75, with the next significant support at 6005.75, indicating a wide range for potential retracement. Short-term, the WSFG trend is down and price is below the weekly NTZ, suggesting some near-term consolidation or a pause after a strong rally, but the overall structure remains constructive. Recent trade signals confirm continued bullish momentum, and the market is currently testing resistance at all-time highs. The environment is characterized by fast momentum, large bars, and a clear sequence of higher highs and higher lows, supporting the prevailing bullish bias for swing traders on longer timeframes, while short-term traders may observe choppy or consolidative action as the market digests gains.
Chart Analysis ATS AI Generated: 2025-08-25 07:07 for Informational use only, not trading advice. Terms and Risk Disclosure Copyright © 2025. Algo Trading Systems LLC.
