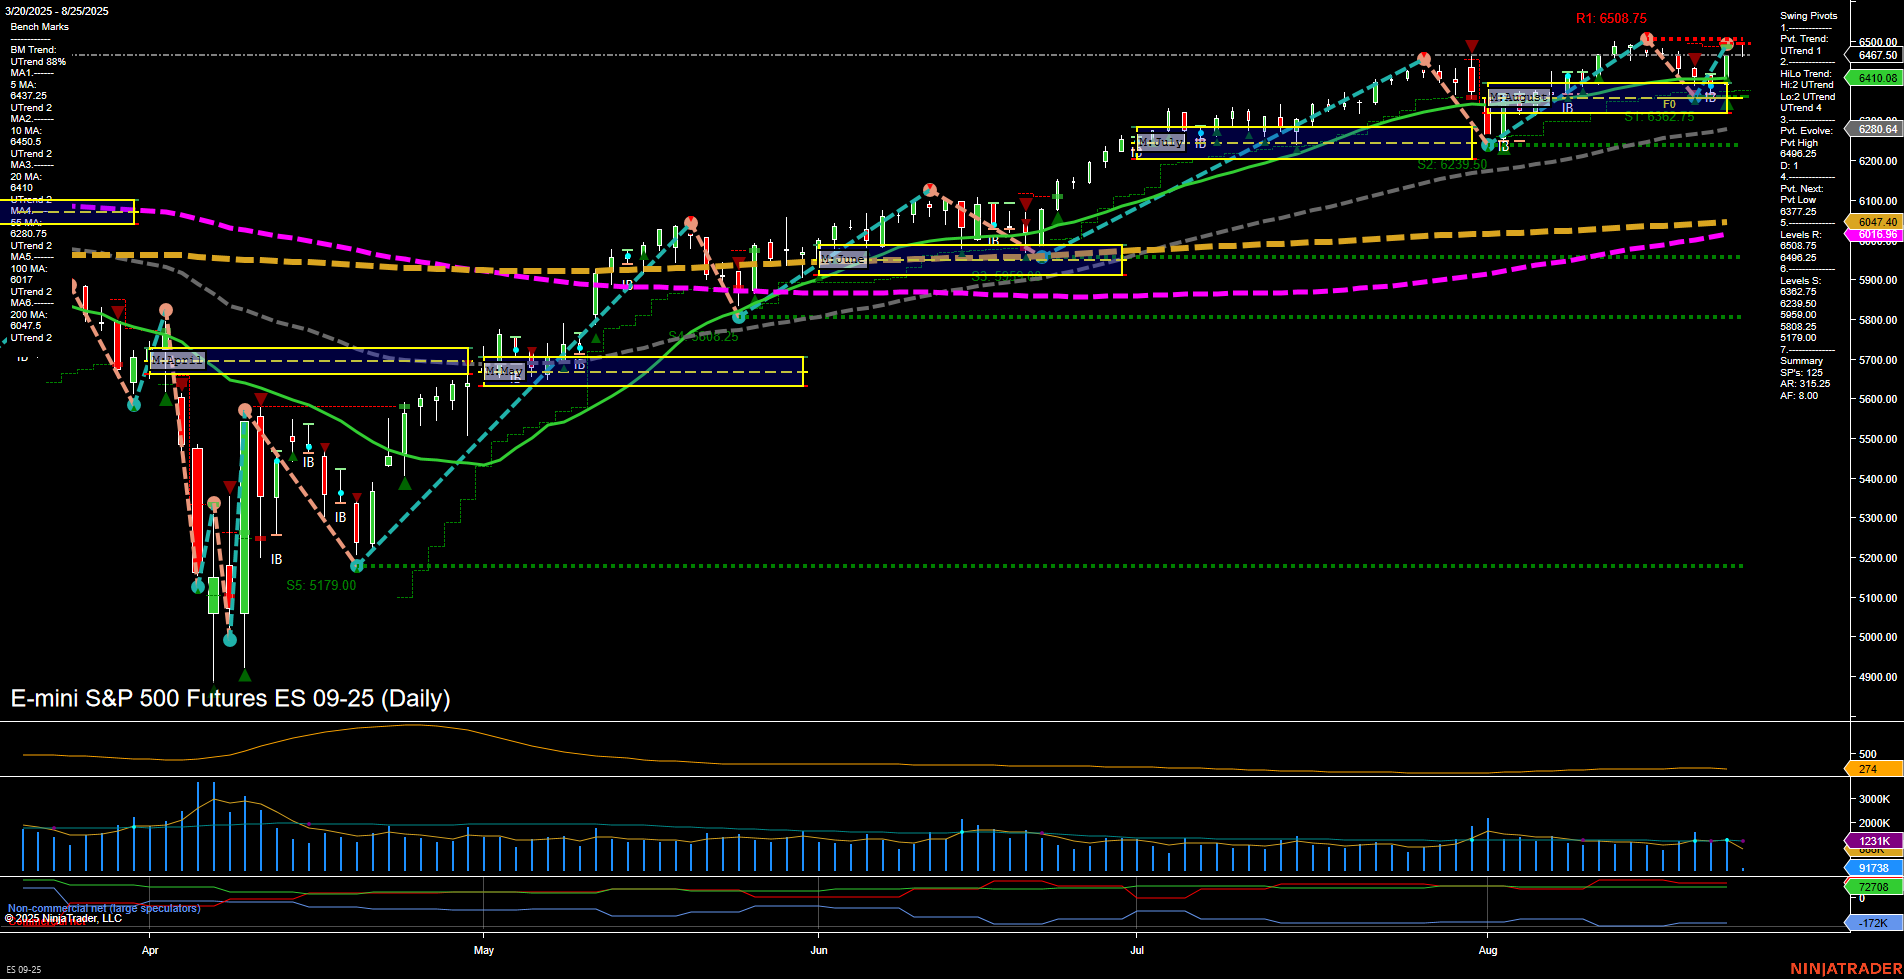
ES E-mini S&P 500 Futures Daily Chart Analysis: 2025-Aug-25 07:06 CT
Price Action
- Last: 6467.50,
- Bars: Medium,
- Mom: Average.
WSFG Weekly
- Short-Term
- WSFG Current: -15%
- F0%/NTZ' Bias: Price Below,
- WSFG Trend: Down.
MSFG Month Aug
- Intermediate-Term
- MSFG Current: 35%
- F0%/NTZ' Bias: Price Above,
- MSFG Trend: Up.
YSFG Year 2025
- Long-Term
- YSFG Current: 38%
- F0%/NTZ' Bias: Price Above,
- YSFG Trend: Up.
Swing Pivots
- (Short-Term) 1. Pvt. Trend: UTrend,
- (Intermediate-Term) 2. HiLo Trend: UTrend,
- 3. Pvt. Evolve: Pvt High 6508.75,
- 4. Pvt. Next: Pvt Low 6208.94,
- 5. Levels R: 6508.75, 6377.25, 6249.75, 6208.94,
- 6. Levels S: 6067.13, 5908.25, 5788.00, 5179.00.
Daily Benchmarks
- (Short-Term) 5 Day: 6437.25 Up Trend,
- (Short-Term) 10 Day: 6410.00 Up Trend,
- (Intermediate-Term) 20 Day: 6410.00 Up Trend,
- (Intermediate-Term) 55 Day: 6047.40 Up Trend,
- (Long-Term) 100 Day: 6067.13 Up Trend,
- (Long-Term) 200 Day: 6280.75 Up Trend.
Additional Metrics
- ATR: 319,
- VOLMA: 1611996.
Recent Trade Signals
- 22 Aug 2025: Long ES 09-25 @ 6489 Signals.USAR-WSFG
- 22 Aug 2025: Long ES 09-25 @ 6489 Signals.USAR.TR120
Overall Rating
- Short-Term: Bullish,
- Intermediate-Term: Bullish,
- Long-Term: Bullish.
Key Insights Summary
The ES E-mini S&P 500 Futures daily chart shows a market in a strong uptrend across all timeframes. Price action is currently consolidating just below recent swing highs, with medium-sized bars and average momentum, suggesting a pause after a recent rally. The short-term WSFG is showing a minor pullback with price below the weekly NTZ, but the overall trend remains up, supported by the monthly and yearly session fib grids, both of which have price above their respective NTZs and are trending higher. Swing pivot analysis confirms the uptrend, with the most recent pivot high at 6508.75 acting as resistance and multiple support levels well below current price, indicating a healthy buffer for any retracement. All benchmark moving averages are in uptrends, reinforcing the bullish structure. Volatility (ATR) and volume metrics are stable, with no signs of excessive froth or exhaustion. Recent trade signals have triggered new long entries, aligning with the prevailing trend. The market is exhibiting classic trend continuation behavior, with higher lows and higher highs, and remains in a constructive technical position for swing traders.
Chart Analysis ATS AI Generated: 2025-08-25 07:06 for Informational use only, not trading advice. Terms and Risk Disclosure Copyright © 2025. Algo Trading Systems LLC.
