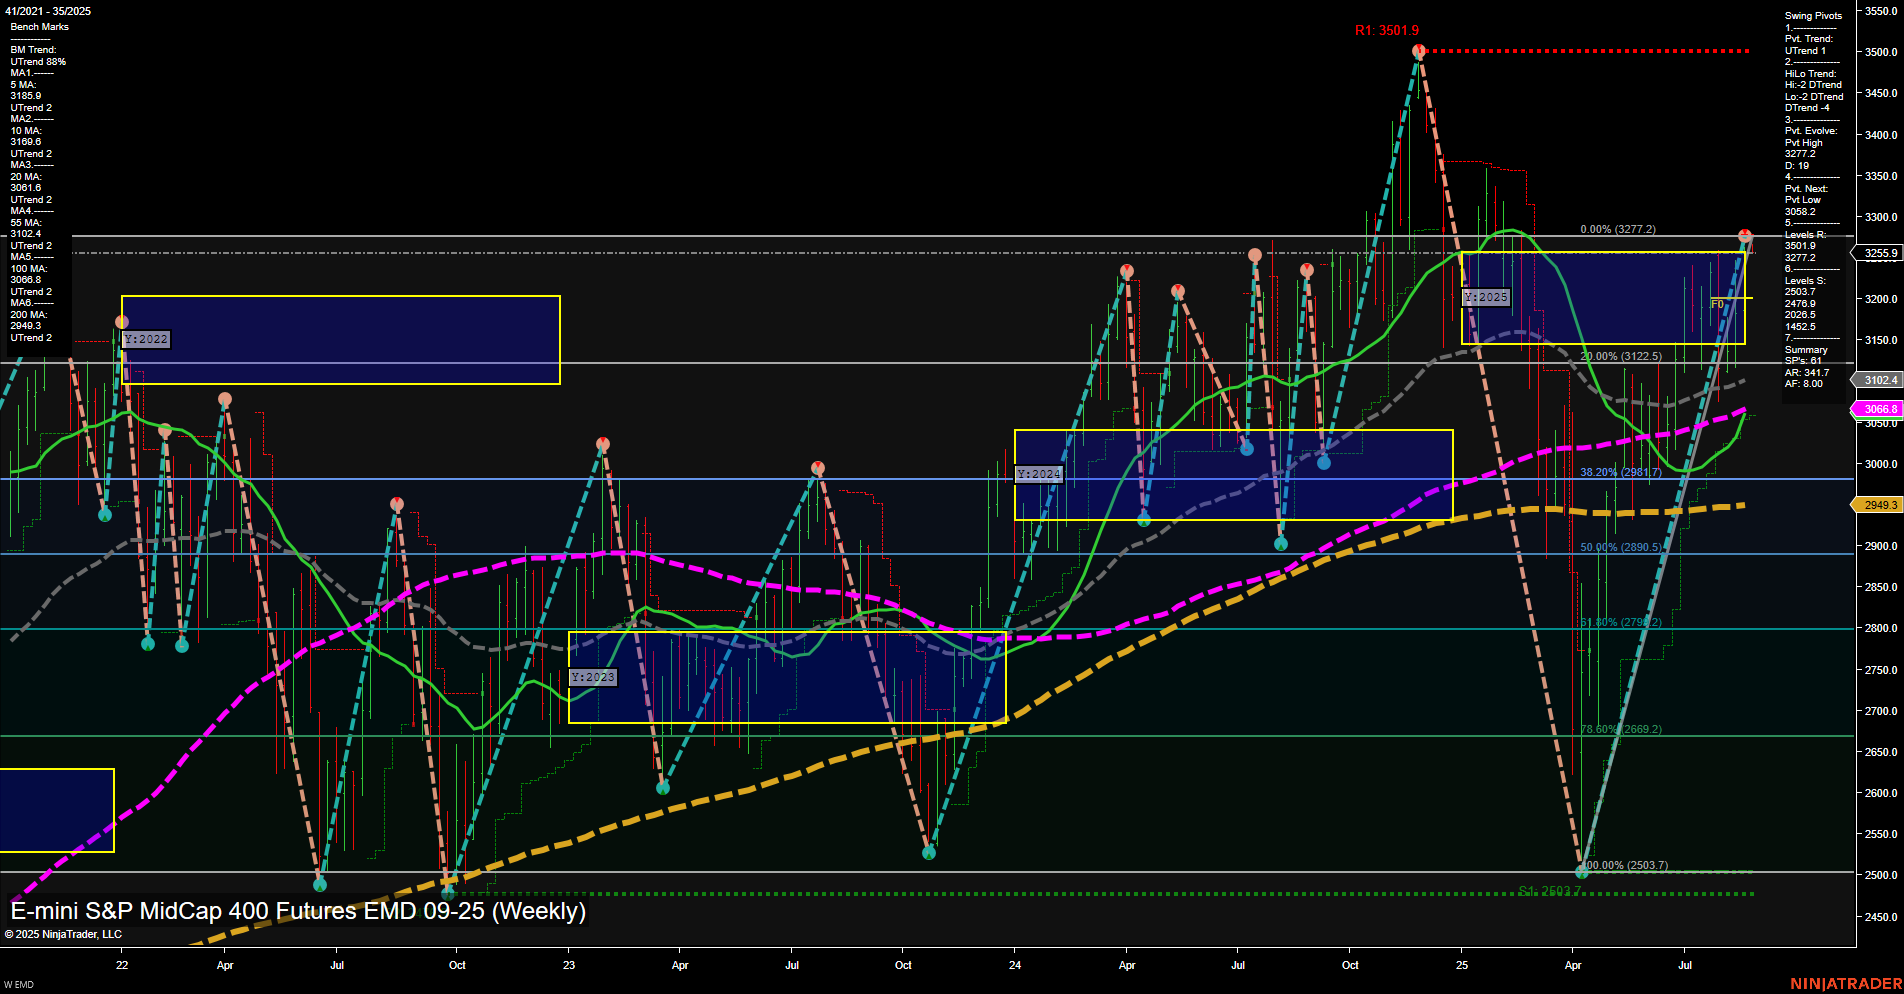
EMD E-mini S&P MidCap 400 Futures Weekly Chart Analysis: 2025-Aug-25 07:21 CT
Price Action
- Last: 3277.2,
- Bars: Large,
- Mom: Momentum fast.
WSFG Weekly
- Short-Term
- WSFG Current: -6%
- F0%/NTZ' Bias: Price Below,
- WSFG Trend: Down.
MSFG Month Aug
- Intermediate-Term
- MSFG Current: 57%
- F0%/NTZ' Bias: Price Above,
- MSFG Trend: Up.
YSFG Year 2025
- Long-Term
- YSFG Current: 10%
- F0%/NTZ' Bias: Price Above,
- YSFG Trend: Up.
Swing Pivots
- (Short-Term) 1. Pvt. Trend: UTrend,
- (Intermediate-Term) 2. HiLo Trend: DTrend,
- 3. Pvt. Evolve: Pvt high 3277.2,
- 4. Pvt. Next: Pvt low 2607.2,
- 5. Levels R: 3501.9, 3277.2,
- 6. Levels S: 2607.2.
Weekly Benchmarks
- (Intermediate-Term) 5 Week: 3102.4 Up Trend,
- (Intermediate-Term) 10 Week: 3068.8 Up Trend,
- (Long-Term) 20 Week: 3006.8 Up Trend,
- (Long-Term) 55 Week: 2943.9 Up Trend,
- (Long-Term) 100 Week: 3068.8 Up Trend,
- (Long-Term) 200 Week: 2943.9 Up Trend.
Recent Trade Signals
- 22 Aug 2025: Long EMD 09-25 @ 3200.2 Signals.USAR-WSFG
- 22 Aug 2025: Long EMD 09-25 @ 3200.2 Signals.USAR.TR120
- 22 Aug 2025: Long EMD 09-25 @ 3191.5 Signals.USAR-MSFG
Overall Rating
- Short-Term: Neutral,
- Intermediate-Term: Bullish,
- Long-Term: Bullish.
Key Insights Summary
The EMD futures weekly chart shows a strong recovery with fast momentum and large bars, indicating heightened volatility and active participation. Price has surged above key long-term moving averages, confirming a bullish bias for both intermediate and long-term horizons. The short-term WSFG trend remains down, with price just below the NTZ, suggesting some near-term resistance or consolidation after the recent rally. Swing pivots highlight a new high at 3277.2, with the next significant support at 2607.2, and resistance at the previous high of 3501.9. Recent trade signals are all long, aligning with the prevailing uptrend in the intermediate and long-term metrics. The overall structure suggests the market is in a strong uptrend with potential for further gains, though short-term consolidation or pullback is possible as the market digests recent advances and tests resistance levels.
Chart Analysis ATS AI Generated: 2025-08-25 07:21 for Informational use only, not trading advice. Terms and Risk Disclosure Copyright © 2025. Algo Trading Systems LLC.
