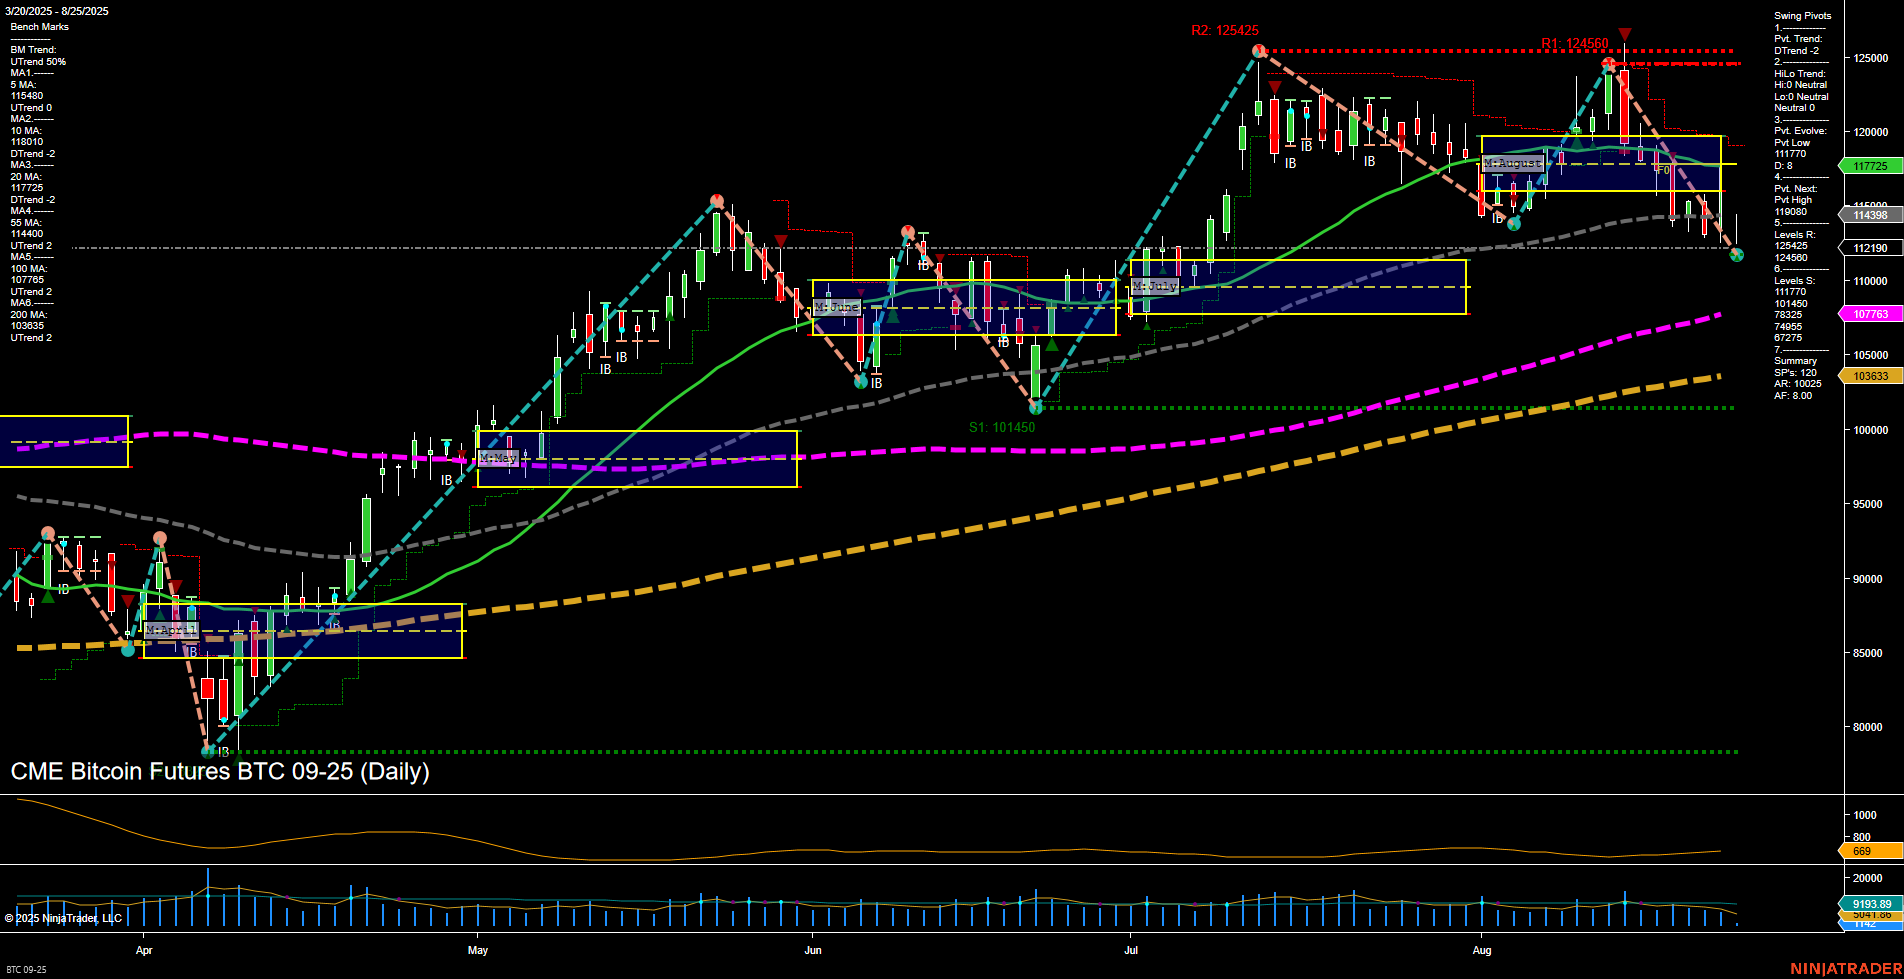
BTC CME Bitcoin Futures Daily Chart Analysis: 2025-Aug-25 07:03 CT
Price Action
- Last: 117725,
- Bars: Medium,
- Mom: Momentum slow.
WSFG Weekly
- Short-Term
- WSFG Current: -33%
- F0%/NTZ' Bias: Price Below,
- WSFG Trend: Down.
MSFG Month Aug
- Intermediate-Term
- MSFG Current: -36%
- F0%/NTZ' Bias: Price Below,
- MSFG Trend: Down.
YSFG Year 2025
- Long-Term
- YSFG Current: 47%
- F0%/NTZ' Bias: Price Above,
- YSFG Trend: Up.
Swing Pivots
- (Short-Term) 1. Pvt. Trend: DTrend,
- (Intermediate-Term) 2. HiLo Trend: Neutral,
- 3. Pvt. Evolve: Pvt low 117725,
- 4. Pvt. Next: Pvt high 124650,
- 5. Levels R: 125425, 124650, 119965, 117725,
- 6. Levels S: 114400, 110700, 107633, 103633.
Daily Benchmarks
- (Short-Term) 5 Day: 115480 Down Trend,
- (Short-Term) 10 Day: 118010 Down Trend,
- (Intermediate-Term) 20 Day: 117725 Down Trend,
- (Intermediate-Term) 55 Day: 114400 Up Trend,
- (Long-Term) 100 Day: 107633 Up Trend,
- (Long-Term) 200 Day: 103633 Up Trend.
Additional Metrics
Recent Trade Signals
- 22 Aug 2025: Long BTC 08-25 @ 117245 Signals.USAR.TR120
- 19 Aug 2025: Short BTC 08-25 @ 113905 Signals.USAR-MSFG
- 19 Aug 2025: Short BTC 08-25 @ 113905 Signals.USAR.TR720
- 18 Aug 2025: Short BTC 08-25 @ 116615 Signals.USAR-WSFG
Overall Rating
- Short-Term: Bearish,
- Intermediate-Term: Bearish,
- Long-Term: Bullish.
Key Insights Summary
BTC CME futures are currently experiencing a short-term and intermediate-term pullback, with price action below both the weekly and monthly session fib grid NTZ centers and a prevailing downtrend in these timeframes. The most recent swing pivot has shifted to a new low at 117725, with the next potential reversal at the 124650 swing high, indicating a possible area for a counter-trend bounce if momentum shifts. Resistance is stacked above at 119965, 124650, and 125425, while support is layered at 114400, 110700, and further below. Daily benchmarks confirm the short-term and intermediate-term downtrend, as the 5, 10, and 20-day moving averages are all trending lower, while the 55, 100, and 200-day averages remain in uptrends, reflecting the underlying long-term bullish structure. Volatility (ATR) is moderate, and volume remains steady. Recent trade signals show a mix of short and long entries, highlighting the choppy, corrective nature of the current market phase. Overall, the market is in a corrective phase within a larger uptrend, with the potential for further downside in the short to intermediate term before a possible resumption of the long-term bullish trend.
Chart Analysis ATS AI Generated: 2025-08-25 07:04 for Informational use only, not trading advice. Terms and Risk Disclosure Copyright © 2025. Algo Trading Systems LLC.
