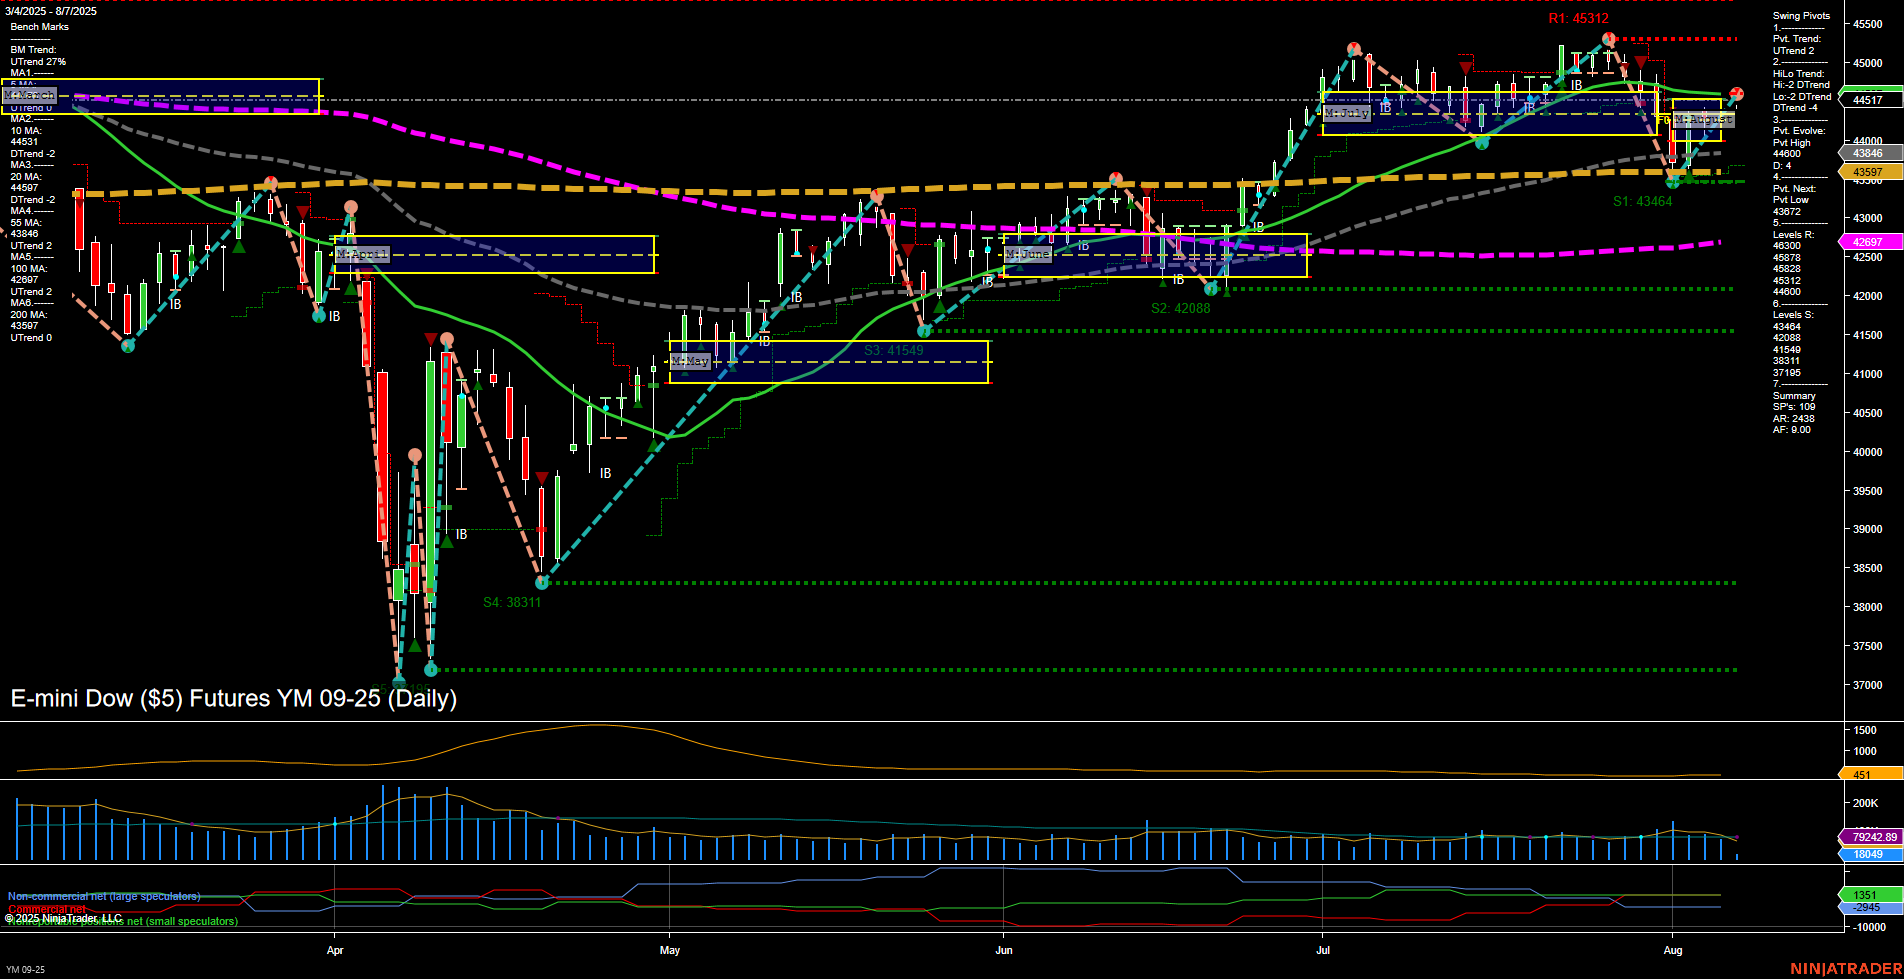
YM E-mini Dow ($5) Futures Daily Chart Analysis: 2025-Aug-07 07:19 CT
Price Action
- Last: 44517,
- Bars: Medium,
- Mom: Average.
WSFG Weekly
- Short-Term
- WSFG Current: 80%
- F0%/NTZ' Bias: Price Above,
- WSFG Trend: Up.
MSFG Month Aug
- Intermediate-Term
- MSFG Current: 11%
- F0%/NTZ' Bias: Price Above,
- MSFG Trend: Up.
YSFG Year 2025
- Long-Term
- YSFG Current: 9%
- F0%/NTZ' Bias: Price Above,
- YSFG Trend: Up.
Swing Pivots
- (Short-Term) 1. Pvt. Trend: DTrend,
- (Intermediate-Term) 2. HiLo Trend: DTrend,
- 3. Pvt. Evolve: Pvt High 44049,
- 4. Pvt. Next: Pvt Low 42967,
- 5. Levels R: 45312, 44049,
- 6. Levels S: 43464, 42967.
Daily Benchmarks
- (Short-Term) 5 Day: 44531 Down Trend,
- (Short-Term) 10 Day: 44597 Down Trend,
- (Intermediate-Term) 20 Day: 44567 Down Trend,
- (Intermediate-Term) 55 Day: 43486 Up Trend,
- (Long-Term) 100 Day: 43207 Up Trend,
- (Long-Term) 200 Day: 43547 Up Trend.
Additional Metrics
Recent Trade Signals
- 07 Aug 2025: Long YM 09-25 @ 44551 Signals.USAR-MSFG
- 04 Aug 2025: Long YM 09-25 @ 44209 Signals.USAR.TR120
- 04 Aug 2025: Long YM 09-25 @ 43901 Signals.USAR-WSFG
- 01 Aug 2025: Short YM 09-25 @ 44238 Signals.USAR.TR720
Overall Rating
- Short-Term: Neutral,
- Intermediate-Term: Bullish,
- Long-Term: Bullish.
Key Insights Summary
The YM E-mini Dow is currently trading above key session fib grid levels across weekly, monthly, and yearly timeframes, indicating a persistent uptrend bias in the intermediate and long-term outlooks. However, short-term swing pivots and moving averages have shifted to a downtrend, suggesting a recent pullback or consolidation phase after a strong rally. The most recent price action shows medium-sized bars and average momentum, with volatility (ATR) and volume (VOLMA) at moderate levels. Resistance is established at 45312 and 44049, while support is seen at 43464 and 42967, framing the current trading range. Recent trade signals show a mix of long entries on short- and intermediate-term signals, with a prior short signal on the longer-term trend, reflecting a market in transition. Overall, the market is digesting gains, with short-term consolidation against a backdrop of intermediate and long-term bullish structure, as price remains above major moving averages and session fib grid centers.
Chart Analysis ATS AI Generated: 2025-08-07 07:19 for Informational use only, not trading advice. Terms and Risk Disclosure Copyright © 2025. Algo Trading Systems LLC.
