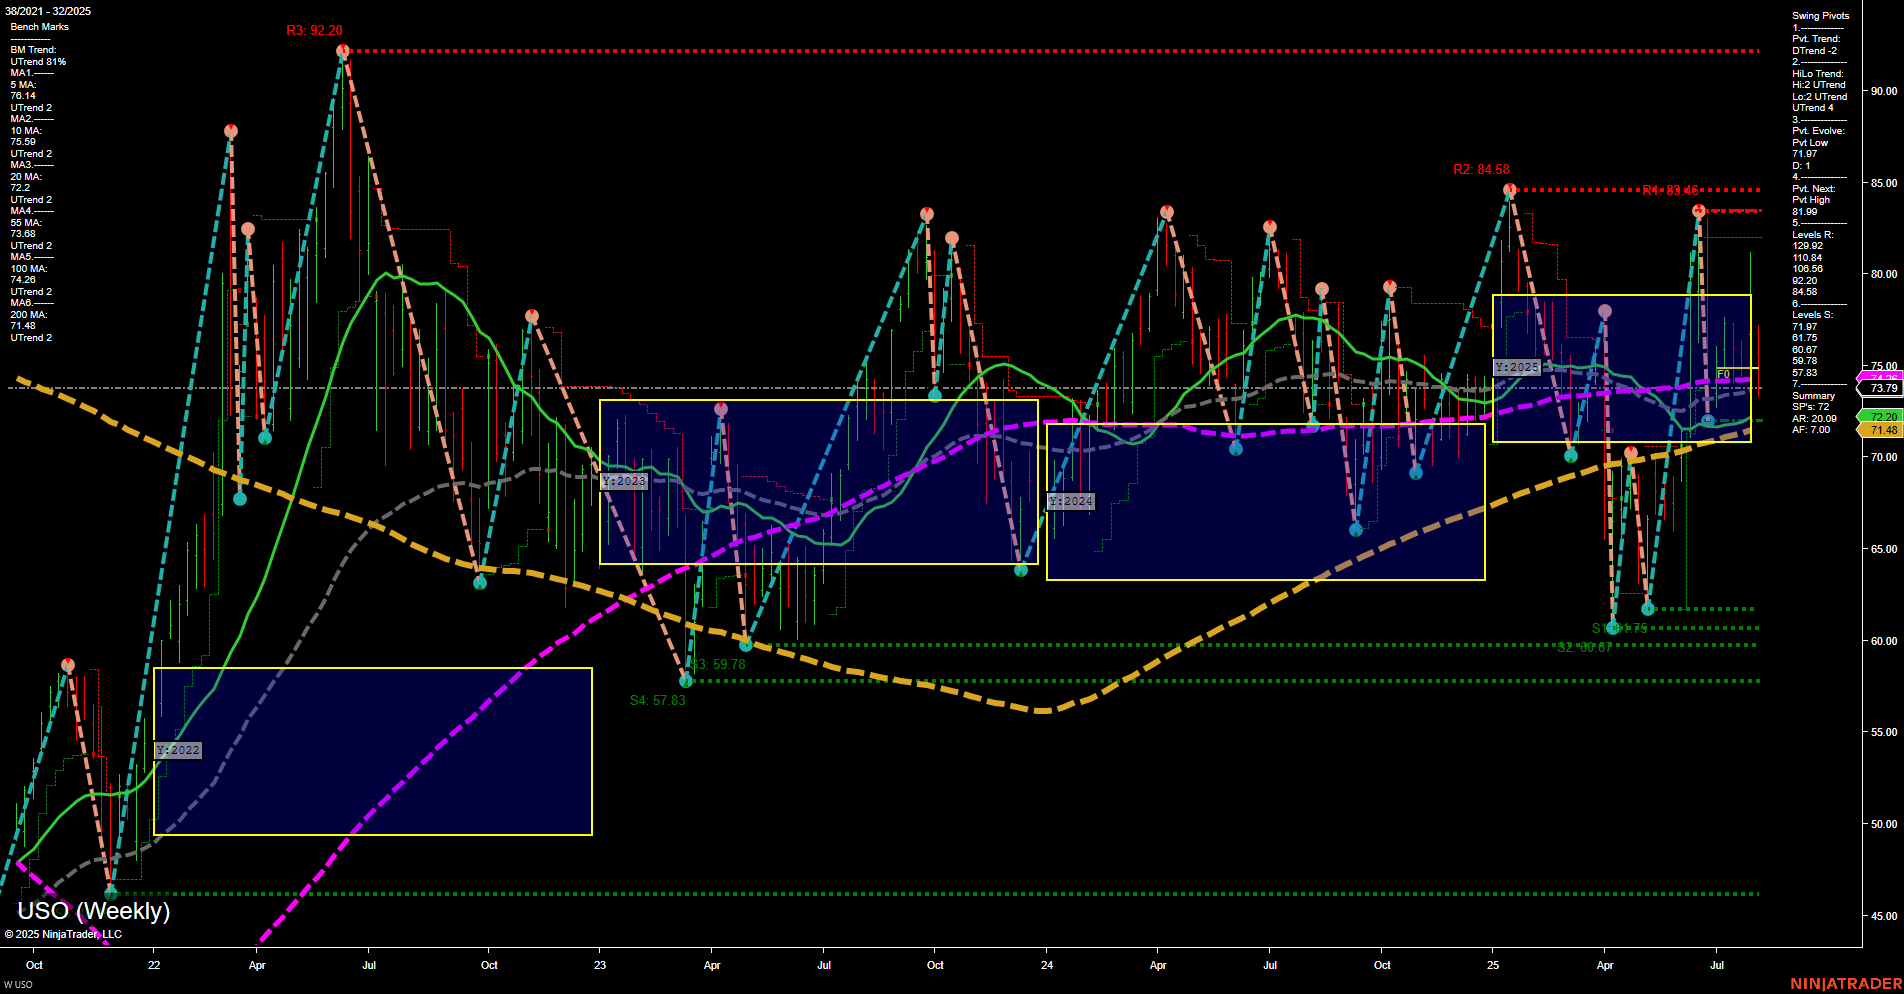
USO United States Oil Fund LP Weekly Chart Analysis: 2025-Aug-07 07:19 CT
Price Action
- Last: 73.79,
- Bars: Medium,
- Mom: Momentum average.
WSFG Weekly
- Short-Term
- WSFG Current: NA%
- F0%/NTZ' Bias: Price Neutral,
- WSFG Trend: Neutral.
MSFG Month Aug
- Intermediate-Term
- MSFG Current: NA%
- F0%/NTZ' Bias: Price Neutral,
- MSFG Trend: Neutral.
YSFG Year 2025
- Long-Term
- YSFG Current: NA%
- F0%/NTZ' Bias: Price Neutral,
- YSFG Trend: Neutral.
Swing Pivots
- (Short-Term) 1. Pvt. Trend: DTrend,
- (Intermediate-Term) 2. HiLo Trend: UTrend,
- 3. Pvt. Evolve: Pvt High 83.46,
- 4. Pvt. Next: Pvt Low 66.75,
- 5. Levels R: 92.20, 90.00, 84.58, 83.46,
- 6. Levels S: 66.75, 59.78, 57.83.
Weekly Benchmarks
- (Intermediate-Term) 5 Week: 75.00 Down Trend,
- (Intermediate-Term) 10 Week: 74.26 Down Trend,
- (Long-Term) 20 Week: 73.79 Down Trend,
- (Long-Term) 55 Week: 72.29 Up Trend,
- (Long-Term) 100 Week: 71.48 Up Trend,
- (Long-Term) 200 Week: 60.07 Up Trend.
Overall Rating
- Short-Term: Neutral,
- Intermediate-Term: Neutral,
- Long-Term: Neutral.
Key Insights Summary
USO is currently trading in a broad consolidation range, with price action showing medium-sized bars and average momentum, indicating a lack of strong directional conviction. The short-term swing pivot trend is down, but the intermediate-term HiLo trend remains up, reflecting a market caught between recent pullbacks and longer-term recovery attempts. All major session Fib grid trends (weekly, monthly, yearly) are neutral, and price is oscillating around key moving averages, with short- and intermediate-term benchmarks trending down while longer-term averages are still in uptrends. Resistance is layered above at 83.46–92.20, while support is established at 66.75 and below, suggesting a wide trading band. The overall technical structure points to a choppy, range-bound environment, with neither bulls nor bears in clear control, and no strong breakout or breakdown signals present at this time.
Chart Analysis ATS AI Generated: 2025-08-07 07:19 for Informational use only, not trading advice. Terms and Risk Disclosure Copyright © 2025. Algo Trading Systems LLC.
