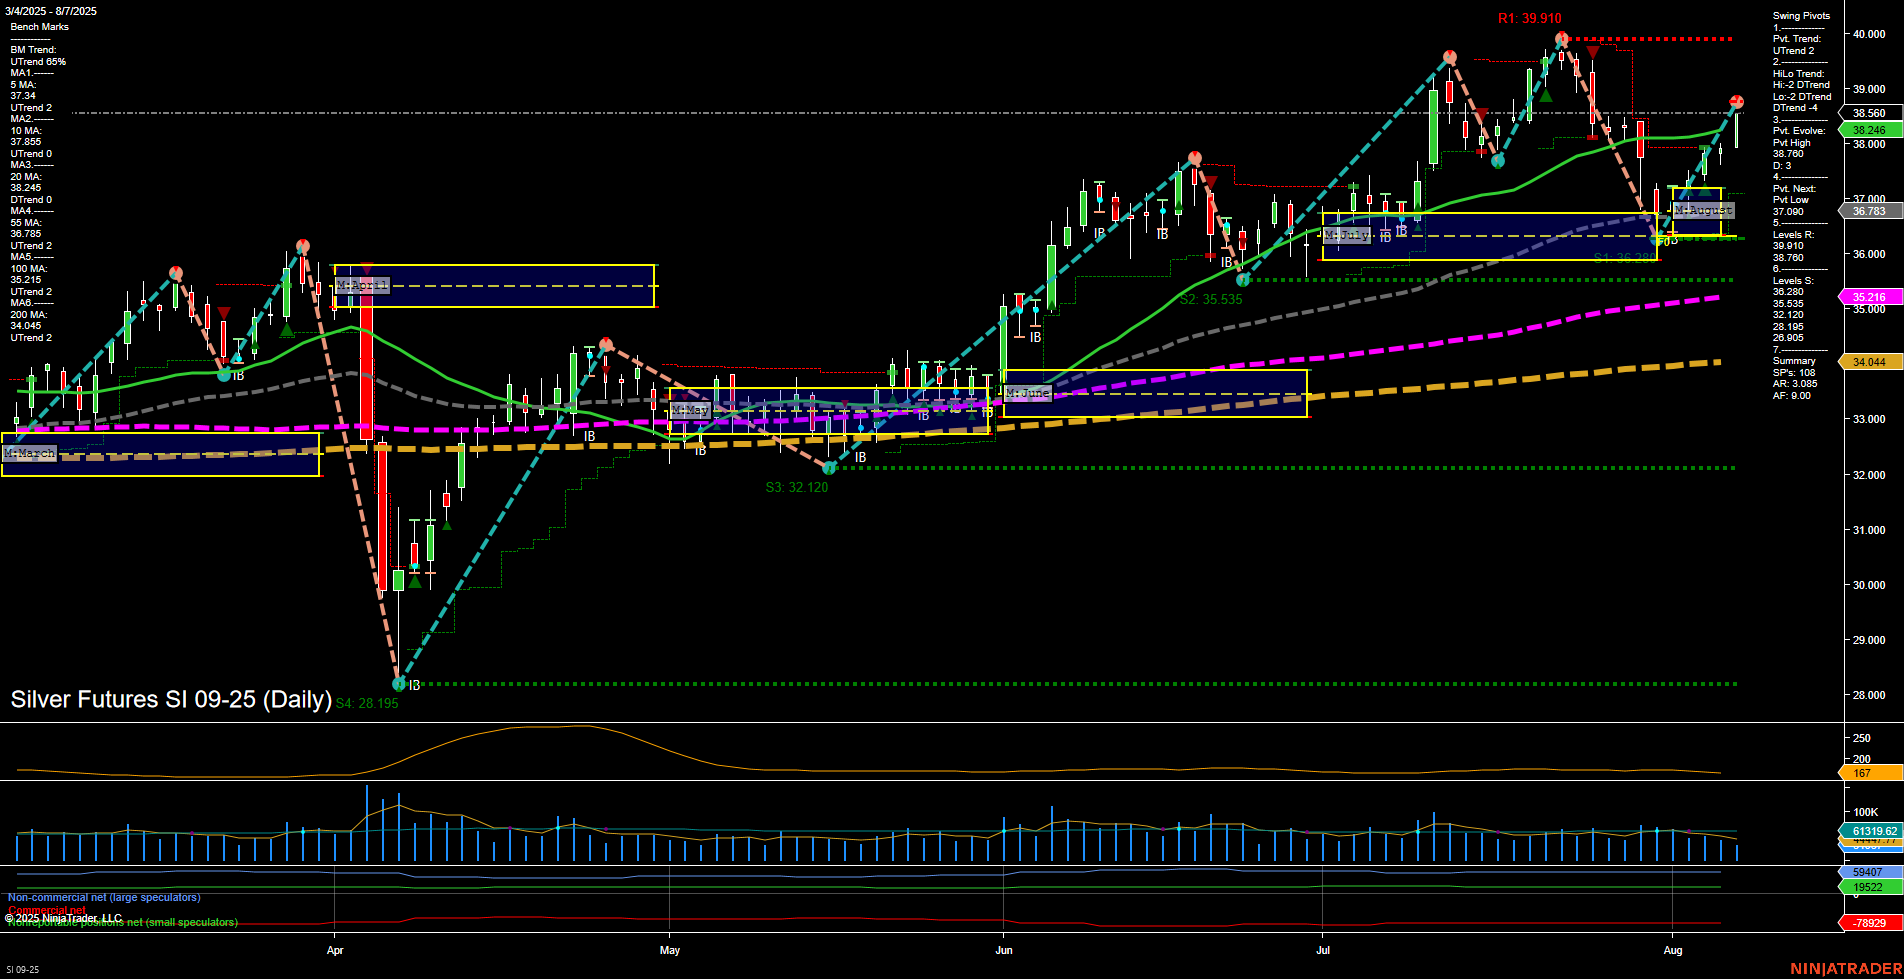
SI Silver Futures Daily Chart Analysis: 2025-Aug-07 07:15 CT
Price Action
- Last: 38.226,
- Bars: Medium,
- Mom: Average.
WSFG Weekly
- Short-Term
- WSFG Current: 68%
- F0%/NTZ' Bias: Price Above,
- WSFG Trend: Up.
MSFG Month Aug
- Intermediate-Term
- MSFG Current: 55%
- F0%/NTZ' Bias: Price Above,
- MSFG Trend: Up.
YSFG Year 2025
- Long-Term
- YSFG Current: 97%
- F0%/NTZ' Bias: Price Above,
- YSFG Trend: Up.
Swing Pivots
- (Short-Term) 1. Pvt. Trend: UTrend,
- (Intermediate-Term) 2. HiLo Trend: DTrend,
- 3. Pvt. Evolve: Pvt High 38.226,
- 4. Pvt. Next: Pvt Low 37.000,
- 5. Levels R: 39.910, 38.560,
- 6. Levels S: 36.783, 35.535, 32.120, 28.195.
Daily Benchmarks
- (Short-Term) 5 Day: 37.934 Up Trend,
- (Short-Term) 10 Day: 37.885 Up Trend,
- (Intermediate-Term) 20 Day: 38.246 Up Trend,
- (Intermediate-Term) 55 Day: 36.783 Up Trend,
- (Long-Term) 100 Day: 35.216 Up Trend,
- (Long-Term) 200 Day: 34.044 Up Trend.
Additional Metrics
Recent Trade Signals
- 05 Aug 2025: Long SI 09-25 @ 37.395 Signals.USAR-MSFG
- 05 Aug 2025: Long SI 09-25 @ 37.48 Signals.USAR-WSFG
- 04 Aug 2025: Long SI 09-25 @ 37.165 Signals.USAR.TR120
- 30 Jul 2025: Short SI 09-25 @ 37.695 Signals.USAR.TR720
Overall Rating
- Short-Term: Bullish,
- Intermediate-Term: Bullish,
- Long-Term: Bullish.
Key Insights Summary
Silver futures are exhibiting a strong bullish structure across all timeframes. Price action is supported by medium-sized bars and average momentum, with the last price at 38.226, trading above all key moving averages. The weekly and monthly session fib grids both show price above their respective NTZ centers, confirming upward bias and trend. Swing pivots indicate a short-term uptrend, though the intermediate-term HiLo trend is still in a corrective phase (DTrend), suggesting the market recently overcame a pullback and is now resuming higher. Resistance is noted at 39.910 and 38.560, with support levels at 36.783 and below, providing clear reference points for potential retracements or breakouts. All benchmark moving averages are trending up, reinforcing the underlying strength. Recent trade signals have shifted decisively long, aligning with the technical outlook. Volatility (ATR) and volume (VOLMA) are moderate, supporting the sustainability of the current move. Overall, the market is in a bullish phase, with higher lows and a recovery from recent corrections, favoring trend continuation scenarios.
Chart Analysis ATS AI Generated: 2025-08-07 07:16 for Informational use only, not trading advice. Terms and Risk Disclosure Copyright © 2025. Algo Trading Systems LLC.
