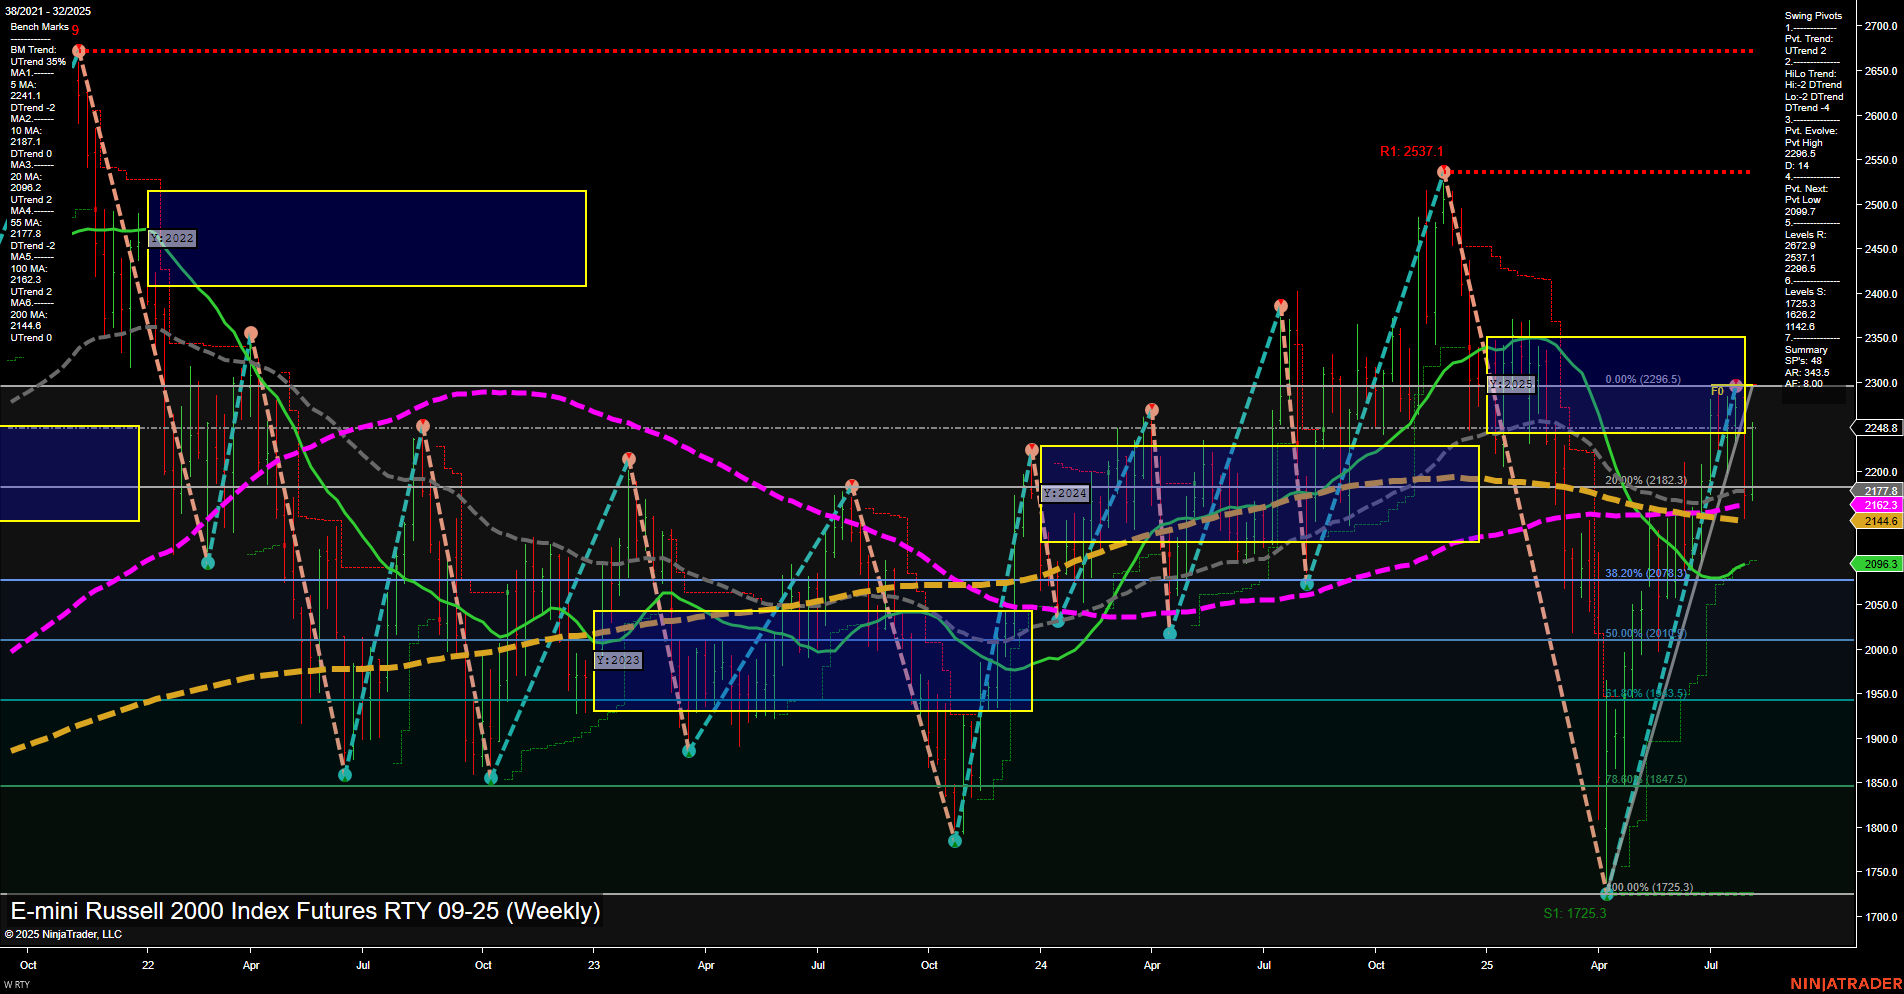
RTY E-mini Russell 2000 Index Futures Weekly Chart Analysis: 2025-Aug-07 07:15 CT
Price Action
- Last: 2248.7,
- Bars: Large,
- Mom: Momentum fast.
WSFG Weekly
- Short-Term
- WSFG Current: 86%
- F0%/NTZ' Bias: Price Above,
- WSFG Trend: Up.
MSFG Month Aug
- Intermediate-Term
- MSFG Current: 17%
- F0%/NTZ' Bias: Price Above,
- MSFG Trend: Up.
YSFG Year 2025
- Long-Term
- YSFG Current: -9%
- F0%/NTZ' Bias: Price Below,
- YSFG Trend: Down.
Swing Pivots
- (Short-Term) 1. Pvt. Trend: UTrend,
- (Intermediate-Term) 2. HiLo Trend: DTrend,
- 3. Pvt. Evolve: Pvt high 2249.6,
- 4. Pvt. Next: Pvt low 2099.5,
- 5. Levels R: 2537.1, 2325.7, 2263.8,
- 6. Levels S: 2099.5, 1725.3.
Weekly Benchmarks
- (Intermediate-Term) 5 Week: 2177.6 Up Trend,
- (Intermediate-Term) 10 Week: 2144.6 Up Trend,
- (Long-Term) 20 Week: 2162.3 Up Trend,
- (Long-Term) 55 Week: 2096.3 Up Trend,
- (Long-Term) 100 Week: 2162.2 Down Trend,
- (Long-Term) 200 Week: 2144.6 Up Trend.
Recent Trade Signals
- 07 Aug 2025: Long RTY 09-25 @ 2248.7 Signals.USAR-MSFG
- 04 Aug 2025: Long RTY 09-25 @ 2207.9 Signals.USAR.TR120
- 01 Aug 2025: Short RTY 09-25 @ 2180.6 Signals.USAR.TR720
- 30 Jul 2025: Short RTY 09-25 @ 2263.8 Signals.USAR-WSFG
Overall Rating
- Short-Term: Bullish,
- Intermediate-Term: Neutral,
- Long-Term: Bearish.
Key Insights Summary
The RTY is showing strong short-term momentum with large bars and fast price action, supported by an uptrend in the weekly session fib grid and recent long signals. Price is currently above the NTZ center, indicating bullish short-term sentiment. Intermediate-term signals are mixed: while the monthly fib grid and most moving averages are trending up, the swing pivot HiLo trend remains down, suggesting some caution as the market may be in a transition phase. Long-term, the yearly fib grid trend is still down, and the 100-week moving average is in a downtrend, reflecting persistent overhead resistance and a broader bearish structure. Key resistance levels are at 2263.8, 2325.7, and 2537.1, while support is found at 2099.5 and 1725.3. The market has recently bounced sharply from support, but faces significant resistance overhead, indicating a possible consolidation or retest of recent highs before a decisive breakout or reversal. Volatility remains elevated, and the market is at a critical juncture between short-term bullish momentum and longer-term bearish pressure.
Chart Analysis ATS AI Generated: 2025-08-07 07:15 for Informational use only, not trading advice. Terms and Risk Disclosure Copyright © 2025. Algo Trading Systems LLC.
