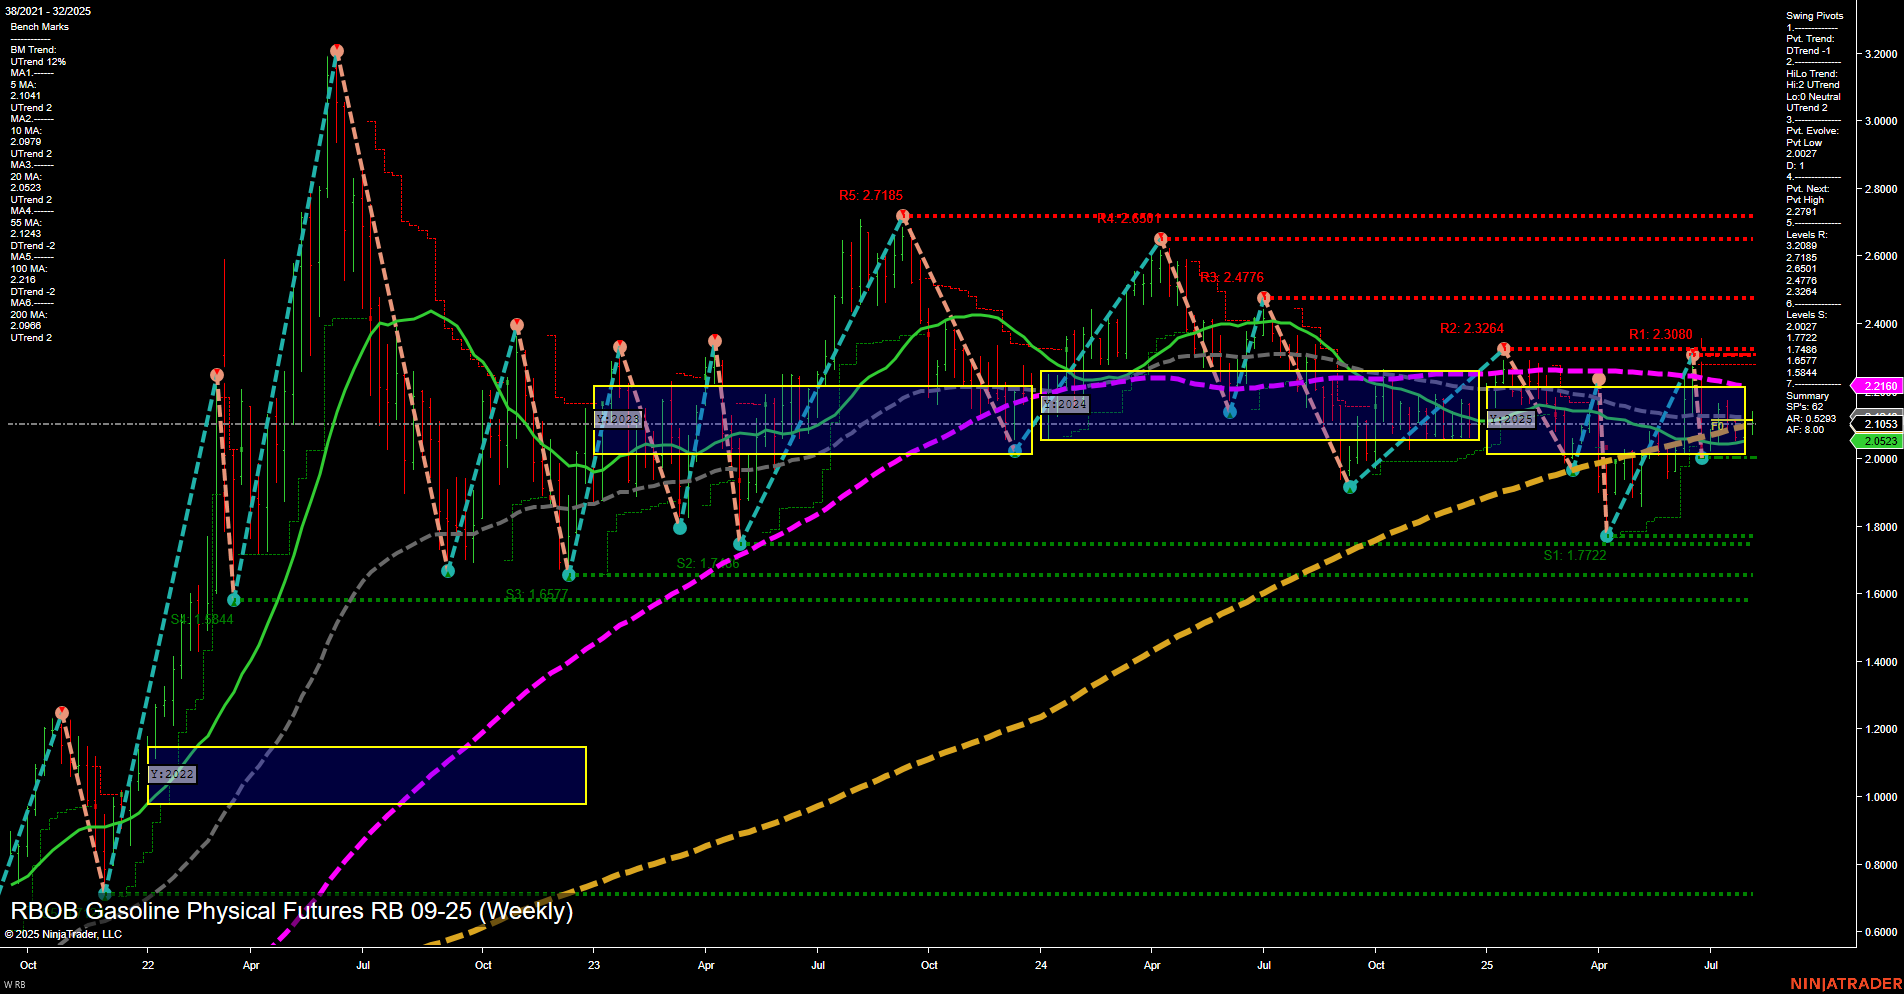
RB RBOB Gasoline Physical Futures Weekly Chart Analysis: 2025-Aug-07 07:14 CT
Price Action
- Last: 2.0953,
- Bars: Medium,
- Mom: Momentum slow.
WSFG Weekly
- Short-Term
- WSFG Current: 0%
- F0%/NTZ' Bias: Price Neutral,
- WSFG Trend: Neutral.
MSFG Month Aug
- Intermediate-Term
- MSFG Current: -24%
- F0%/NTZ' Bias: Price Below,
- MSFG Trend: Down.
YSFG Year 2025
- Long-Term
- YSFG Current: -1%
- F0%/NTZ' Bias: Price Below,
- YSFG Trend: Down.
Swing Pivots
- (Short-Term) 1. Pvt. Trend: DTrend,
- (Intermediate-Term) 2. HiLo Trend: UTrend,
- 3. Pvt. Evolve: Pvt Low 2.027,
- 4. Pvt. Next: Pvt High 2.2091,
- 5. Levels R: 2.7185, 2.6508, 2.4776, 2.3264, 2.3080,
- 6. Levels S: 2.1772, 1.7488, 1.6847, 1.4577, 1.1772.
Weekly Benchmarks
- (Intermediate-Term) 5 Week: 2.1041 Down Trend,
- (Intermediate-Term) 10 Week: 2.0720 Down Trend,
- (Long-Term) 20 Week: 2.0533 Up Trend,
- (Long-Term) 55 Week: 2.1544 Down Trend,
- (Long-Term) 100 Week: 2.2168 Down Trend,
- (Long-Term) 200 Week: 2.0800 Up Trend.
Recent Trade Signals
- 06 Aug 2025: Short RB 09-25 @ 2.0835 Signals.USAR-WSFG
- 06 Aug 2025: Short RB 09-25 @ 2.1186 Signals.USAR-MSFG
- 31 Jul 2025: Short RB 09-25 @ 2.1674 Signals.USAR.TR120
Overall Rating
- Short-Term: Neutral,
- Intermediate-Term: Bearish,
- Long-Term: Bearish.
Key Insights Summary
The RBOB Gasoline futures market is currently exhibiting a mixed technical structure. Price action is consolidating near the lower end of the yearly and monthly session fib grids, with slow momentum and medium-sized bars, indicating a lack of strong directional conviction. The short-term trend is neutral, as reflected by the WSFG and recent price action within the NTZ (neutral trading zone). However, the intermediate and long-term trends are tilting bearish, with both the MSFG and YSFG showing price below their respective F0% levels and downward trends. Swing pivots highlight a short-term downtrend, but the intermediate-term HiLo trend remains up, suggesting some underlying support or potential for a bounce. Resistance levels are clustered above 2.30, while support is established near 2.17 and lower. Most weekly benchmarks, especially the 5, 10, 55, and 100-week moving averages, are in downtrends, reinforcing the broader bearish bias, though the 20 and 200-week MAs are still up. Recent trade signals have all been to the short side, aligning with the prevailing intermediate and long-term bearish sentiment. Overall, the market is in a corrective or consolidative phase, with downside pressure dominating but some potential for short-term stabilization or retracement.
Chart Analysis ATS AI Generated: 2025-08-07 07:15 for Informational use only, not trading advice. Terms and Risk Disclosure Copyright © 2025. Algo Trading Systems LLC.
