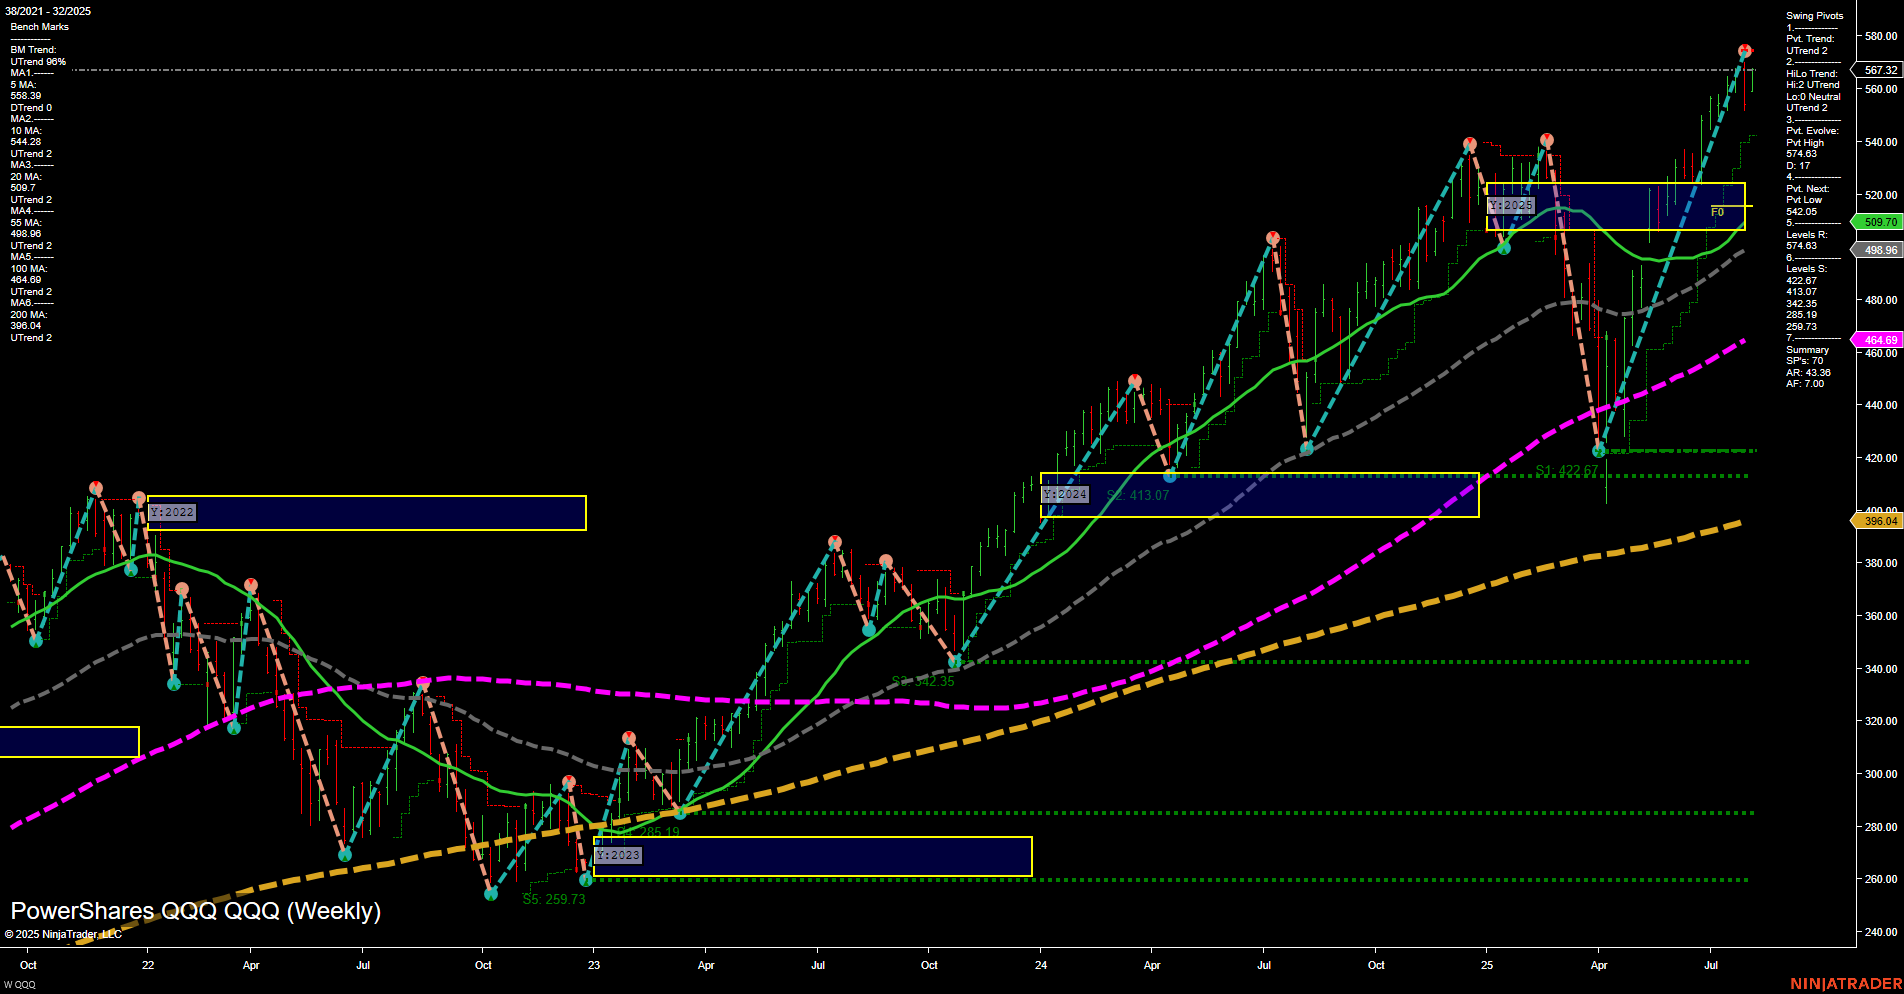
QQQ PowerShares QQQ Weekly Chart Analysis: 2025-Aug-07 07:13 CT
Price Action
- Last: 567.32,
- Bars: Large,
- Mom: Momentum fast.
WSFG Weekly
- Short-Term
- WSFG Current: NA%
- F0%/NTZ' Bias: Price Neutral,
- WSFG Trend: Neutral.
MSFG Month Aug
- Intermediate-Term
- MSFG Current: NA%
- F0%/NTZ' Bias: Price Neutral,
- MSFG Trend: Neutral.
YSFG Year 2025
- Long-Term
- YSFG Current: NA%
- F0%/NTZ' Bias: Price Neutral,
- YSFG Trend: Neutral.
Swing Pivots
- (Short-Term) 1. Pvt. Trend: UTrend,
- (Intermediate-Term) 2. HiLo Trend: UTrend,
- 3. Pvt. Evolve: Pvt high 567.32,
- 4. Pvt. Next: Pvt low 545.05,
- 5. Levels R: 567.32, 574.19,
- 6. Levels S: 545.05, 498.96, 422.67, 396.04, 346.35, 259.73, 222.67.
Weekly Benchmarks
- (Intermediate-Term) 5 Week: 558.34 Up Trend,
- (Intermediate-Term) 10 Week: 547.28 Up Trend,
- (Long-Term) 20 Week: 509.70 Up Trend,
- (Long-Term) 55 Week: 466.69 Up Trend,
- (Long-Term) 100 Week: 446.69 Up Trend,
- (Long-Term) 200 Week: 396.04 Up Trend.
Overall Rating
- Short-Term: Bullish,
- Intermediate-Term: Bullish,
- Long-Term: Bullish.
Key Insights Summary
The QQQ weekly chart shows a strong bullish structure across all timeframes, with price recently making a new swing high at 567.32. Momentum is fast and bars are large, indicating strong participation and conviction in the current uptrend. All benchmark moving averages (5, 10, 20, 55, 100, and 200 week) are trending upward, confirming the strength of the move and providing layered support below. Swing pivot analysis highlights a clear uptrend in both short- and intermediate-term, with the next key support at 545.05 and multiple deeper support levels well below, suggesting the market has room for retracement without threatening the broader trend. The neutral bias in the session fib grids (WSFG, MSFG, YSFG) suggests price is not currently at a major inflection or overextended zone, allowing for continued trend development. Overall, the technical landscape is supportive of trend continuation, with no immediate signs of exhaustion or reversal, and the market remains in a strong, persistent uptrend.
Chart Analysis ATS AI Generated: 2025-08-07 07:14 for Informational use only, not trading advice. Terms and Risk Disclosure Copyright © 2025. Algo Trading Systems LLC.
