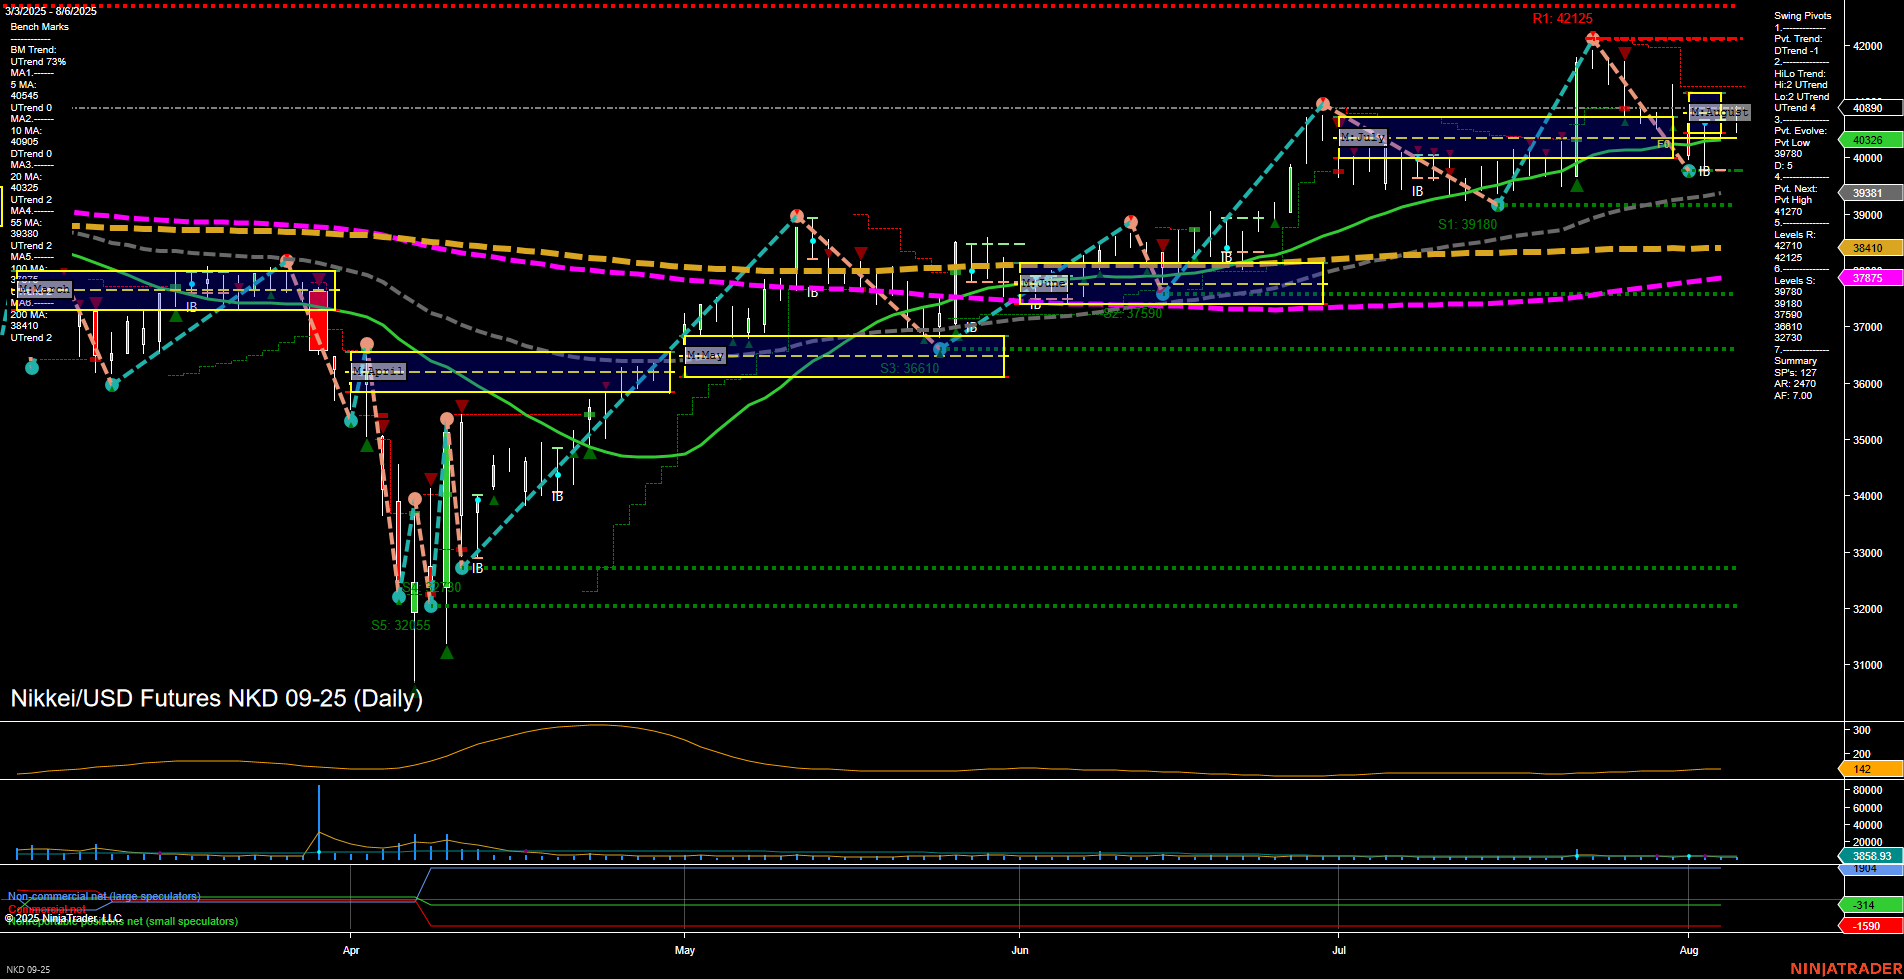
NKD Nikkei/USD Futures Daily Chart Analysis: 2025-Aug-07 07:11 CT
Price Action
- Last: 40326,
- Bars: Medium,
- Mom: Momentum average.
WSFG Weekly
- Short-Term
- WSFG Current: 85%
- F0%/NTZ' Bias: Price Above,
- WSFG Trend: Up.
MSFG Month Aug
- Intermediate-Term
- MSFG Current: 11%
- F0%/NTZ' Bias: Price Above,
- MSFG Trend: Up.
YSFG Year 2025
- Long-Term
- YSFG Current: 16%
- F0%/NTZ' Bias: Price Above,
- YSFG Trend: Up.
Swing Pivots
- (Short-Term) 1. Pvt. Trend: DTrend,
- (Intermediate-Term) 2. HiLo Trend: UTrend,
- 3. Pvt. Evolve: Pvt low 39709,
- 4. Pvt. Next: Pvt high 40890,
- 5. Levels R: 42125, 40890, 40000, 39381,
- 6. Levels S: 39180, 38589, 38180, 37610, 36610, 32730.
Daily Benchmarks
- (Short-Term) 5 Day: 40454 Down Trend,
- (Short-Term) 10 Day: 40696 Down Trend,
- (Intermediate-Term) 20 Day: 40326 Down Trend,
- (Intermediate-Term) 55 Day: 38410 Up Trend,
- (Long-Term) 100 Day: 37675 Up Trend,
- (Long-Term) 200 Day: 38410 Up Trend.
Additional Metrics
- ATR: 142,
- VOLMA: 3858.93.
Recent Trade Signals
- 01 Aug 2025: Short NKD 09-25 @ 40745 Signals.USAR.TR120
- 31 Jul 2025: Long NKD 09-25 @ 41130 Signals.USAR-MSFG
Overall Rating
- Short-Term: Neutral,
- Intermediate-Term: Bullish,
- Long-Term: Bullish.
Key Insights Summary
The NKD Nikkei/USD futures daily chart shows a market that has recently shifted to a short-term corrective phase, with the current swing pivot trend down and short-term moving averages turning lower. However, the intermediate and long-term trends remain firmly up, as indicated by the upward bias in the monthly and yearly session fib grids, as well as the 55, 100, and 200-day moving averages. Price is currently above key session fib grid levels, suggesting underlying strength despite the recent pullback. Resistance is clustered near 40890 and 42125, while support is layered below at 39180 and 38589. Volatility is moderate, and volume remains steady. The recent trade signals reflect this mixed environment, with a short signal following a failed attempt to sustain new highs. Overall, the market is consolidating after a strong rally, with the potential for further upside if support holds and momentum returns, but short-term caution is warranted as the market digests recent gains.
Chart Analysis ATS AI Generated: 2025-08-07 07:12 for Informational use only, not trading advice. Terms and Risk Disclosure Copyright © 2025. Algo Trading Systems LLC.
